Fig. 3
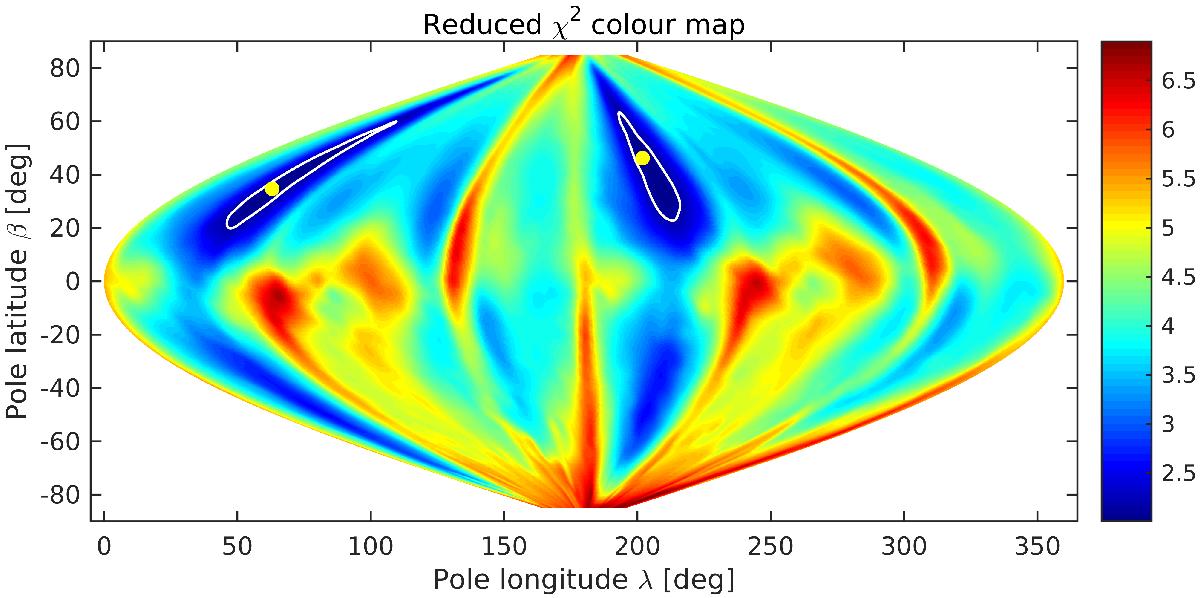
Dependence of the level of fit between the data and the model on the pole direction shown in sinusoidal projection of the sky in ecliptic coordinates. The reduced χ2 is color-coded. There are two local minima for poles P1 and P2 (white circles). The estimated uncertainty of the poles is shown as two solid boundaries around P1 and P2. The uncertainty of the pole latitude β is much larger than that of pole longitude λ.
Current usage metrics show cumulative count of Article Views (full-text article views including HTML views, PDF and ePub downloads, according to the available data) and Abstracts Views on Vision4Press platform.
Data correspond to usage on the plateform after 2015. The current usage metrics is available 48-96 hours after online publication and is updated daily on week days.
Initial download of the metrics may take a while.