Fig. 6
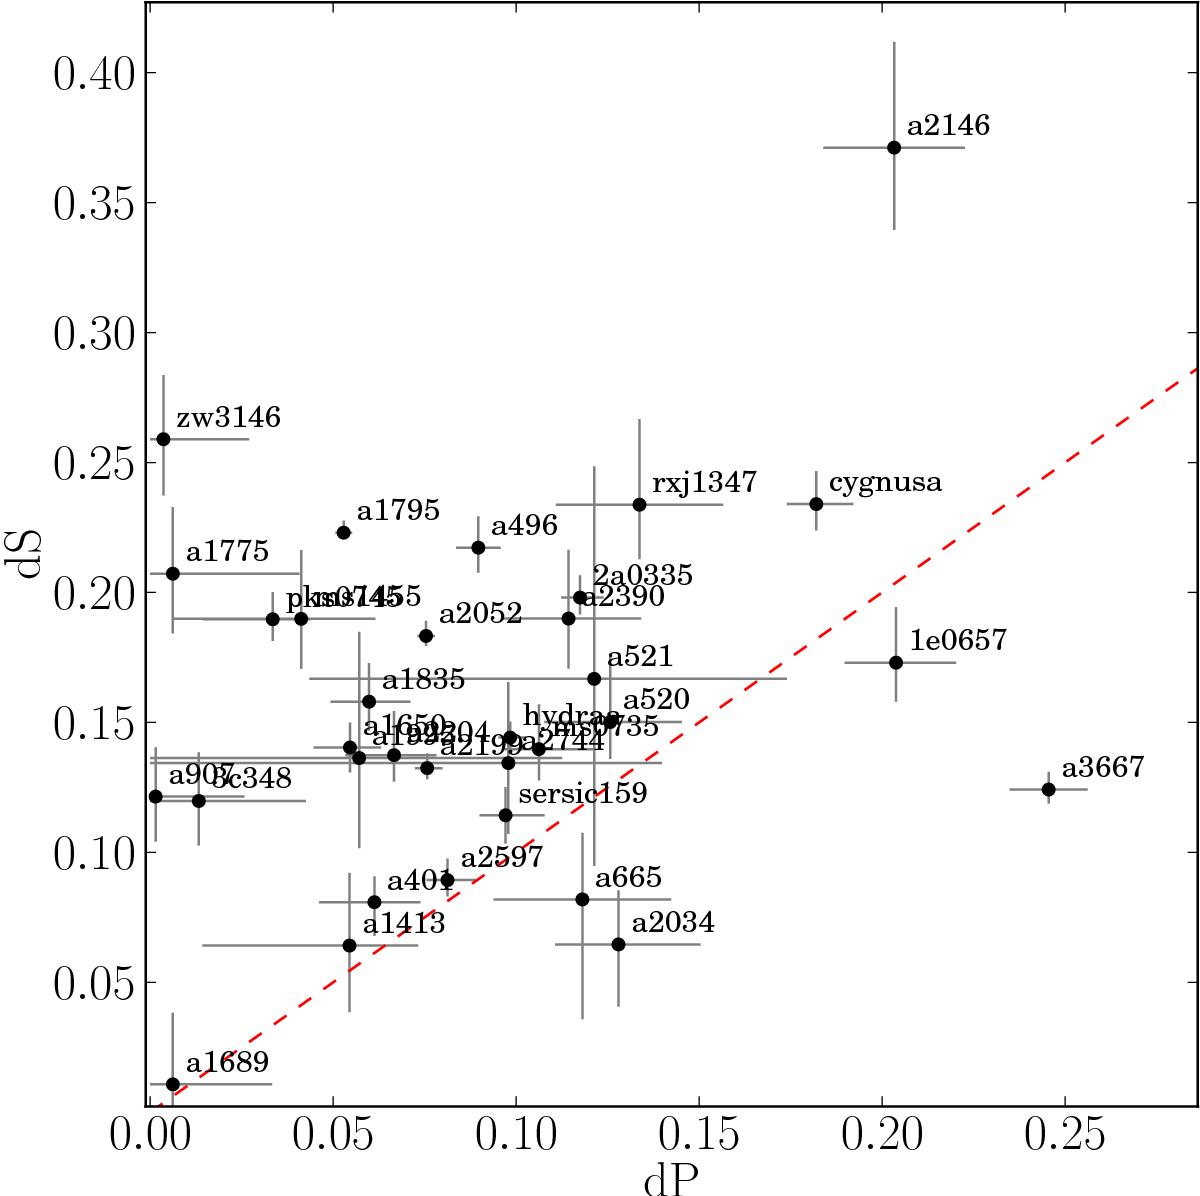
Comparison of average projected pressure and projected entropy fluctuations for all clusters in the sample. The dashed line represents a one-to-one relation. The plot suggests that entropy fluctuations dominate in most clusters of the sample. Error bars are the statistical uncertainty from the MCMC measurements.
Current usage metrics show cumulative count of Article Views (full-text article views including HTML views, PDF and ePub downloads, according to the available data) and Abstracts Views on Vision4Press platform.
Data correspond to usage on the plateform after 2015. The current usage metrics is available 48-96 hours after online publication and is updated daily on week days.
Initial download of the metrics may take a while.