Fig. 9
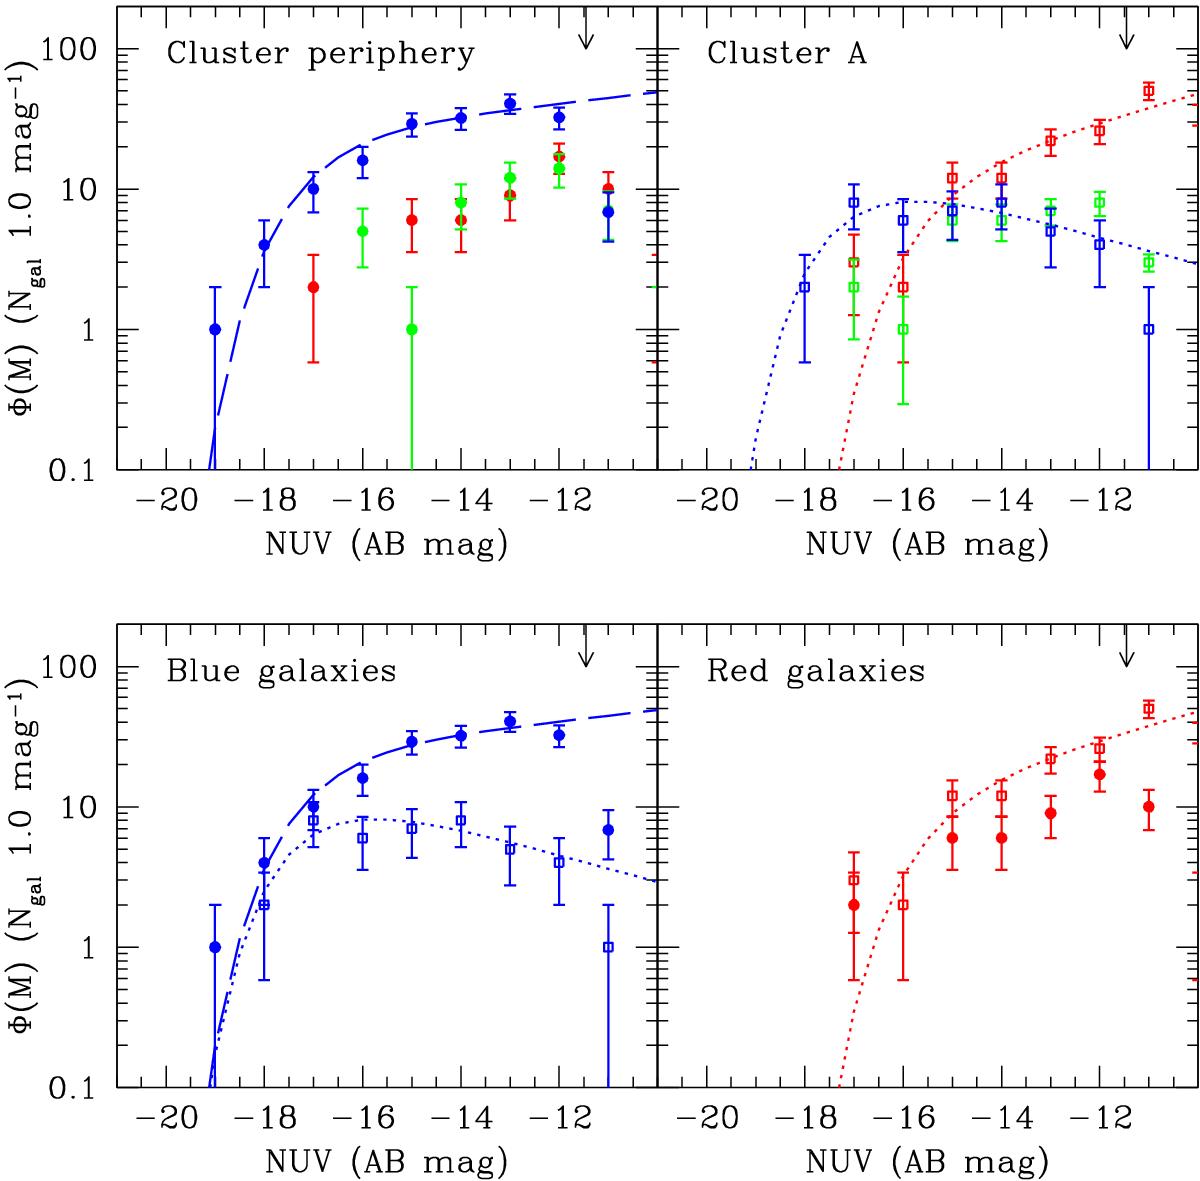
Upper panels: NUV luminosity function of galaxies in the Virgo cluster periphery (left, filled dots) and in the core of cluster A (right, empty squares). Red symbols are for galaxies belonging to the red sequence, green symbols for galaxies in the green valley, and blue symbols for galaxies in the blue cloud. Lower panels: NUV luminosity function of cluster A (empty squares) and cluster periphery (filled dots) galaxies in the blue (left) and red (right) sequences. The red and blue lines give the best fit Schechter functions derived for the different samples. The different luminosity functions have been normalised to approximately the same number of objects.
Current usage metrics show cumulative count of Article Views (full-text article views including HTML views, PDF and ePub downloads, according to the available data) and Abstracts Views on Vision4Press platform.
Data correspond to usage on the plateform after 2015. The current usage metrics is available 48-96 hours after online publication and is updated daily on week days.
Initial download of the metrics may take a while.