Fig. 5
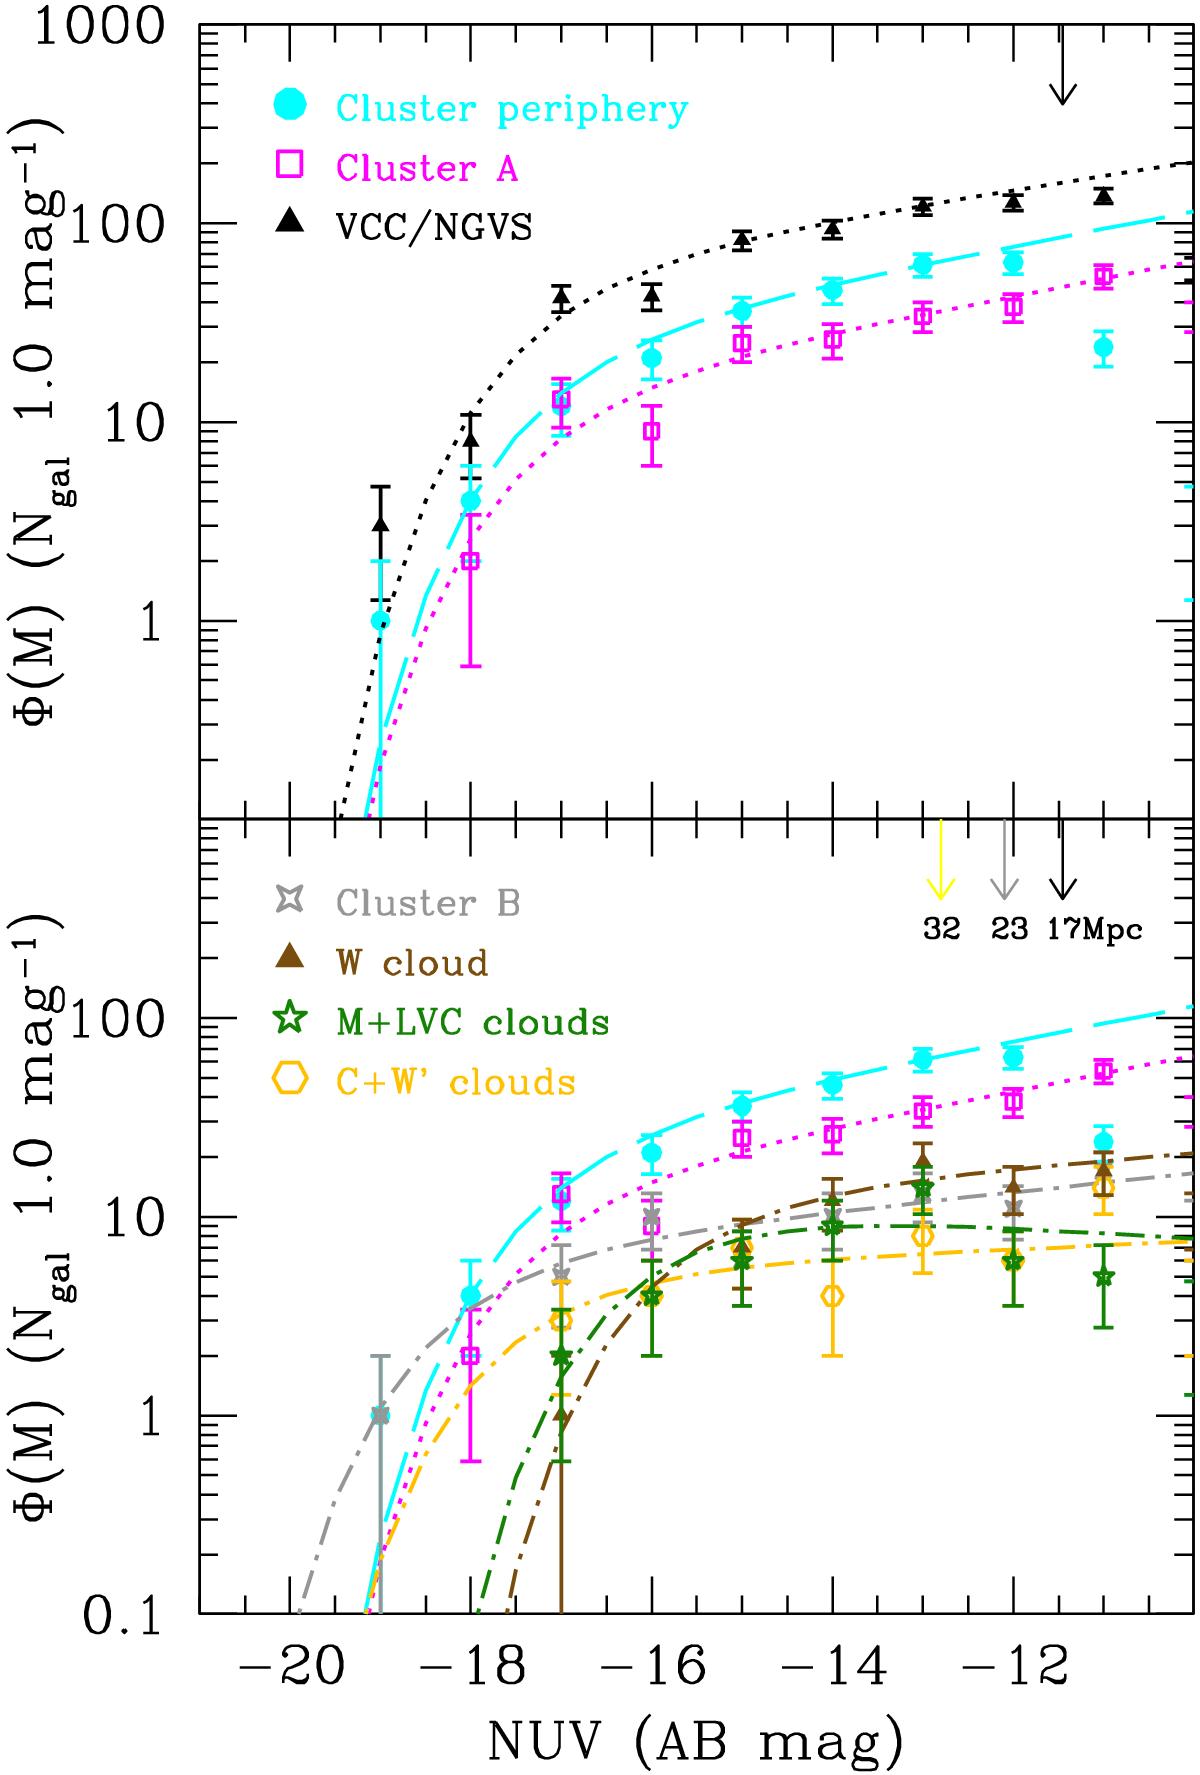
Upper panel: NUV luminosity function of Virgo cluster A (magenta empty squares) and of the cluster periphery (cyan filled dots) are compared to that determined over the 104![]() sampled by the VCC and the NGVS survey (black filled triangles). The best fit Schechter functions are shown by the magenta dotted, cyan long dashed, and black dotted lines, respectively. The vertical arrow shows the limit of completeness of the luminosity function. Lower panel: the same cluster A and periphery luminosity functions are compared to those determined for cluster B (grey empty stars), W cloud (brown filled triangles), M plus low-velocity clouds (LVC; dark green empty stars), and cluster C plus W’ cloud (orange empty hexagons). The vertical arrows show the different limits of completeness for the different cluster substructures: 17 Mpc for cluster A, cluster C, LVC, and the cluster periphery, 23 Mpc for cluster B and W’ cloud, 32 Mpc for W and M clouds.
sampled by the VCC and the NGVS survey (black filled triangles). The best fit Schechter functions are shown by the magenta dotted, cyan long dashed, and black dotted lines, respectively. The vertical arrow shows the limit of completeness of the luminosity function. Lower panel: the same cluster A and periphery luminosity functions are compared to those determined for cluster B (grey empty stars), W cloud (brown filled triangles), M plus low-velocity clouds (LVC; dark green empty stars), and cluster C plus W’ cloud (orange empty hexagons). The vertical arrows show the different limits of completeness for the different cluster substructures: 17 Mpc for cluster A, cluster C, LVC, and the cluster periphery, 23 Mpc for cluster B and W’ cloud, 32 Mpc for W and M clouds.
Current usage metrics show cumulative count of Article Views (full-text article views including HTML views, PDF and ePub downloads, according to the available data) and Abstracts Views on Vision4Press platform.
Data correspond to usage on the plateform after 2015. The current usage metrics is available 48-96 hours after online publication and is updated daily on week days.
Initial download of the metrics may take a while.