Fig. 4
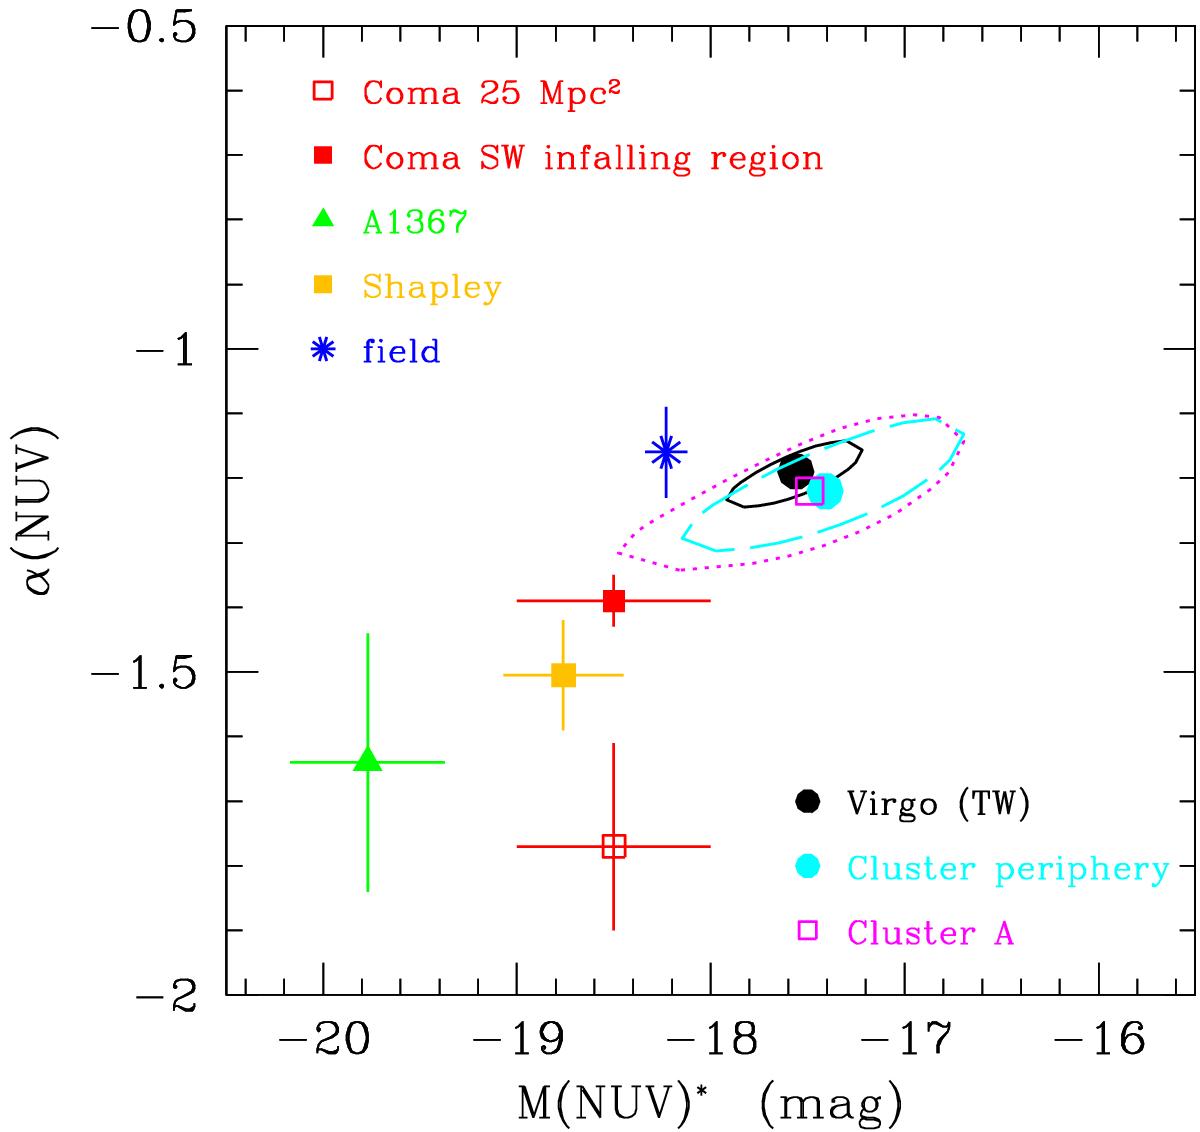
Comparison of the parameters obtained after fitting a Schechter function to the NUV luminosity function of the Virgo cluster (black filled circle), of Virgo cluster A (magenta open square), of the cluster periphery (cyan filled dot), to those determined in Coma over 25 Mpc![]() (red empty square, Cortese et al. 2008) or in its SW infalling region (red filled square, Hammer et al. 2012), in A1367 (green filled triangle, Cortese et al. 2005), in the Shapley supercluster (orange filled square, Haines et al. 2011), and the field (blue asterisk, Wyder et al. 2005). Contours indicate the 1σ probability distribution of the two correlated parameters.
(red empty square, Cortese et al. 2008) or in its SW infalling region (red filled square, Hammer et al. 2012), in A1367 (green filled triangle, Cortese et al. 2005), in the Shapley supercluster (orange filled square, Haines et al. 2011), and the field (blue asterisk, Wyder et al. 2005). Contours indicate the 1σ probability distribution of the two correlated parameters.
Current usage metrics show cumulative count of Article Views (full-text article views including HTML views, PDF and ePub downloads, according to the available data) and Abstracts Views on Vision4Press platform.
Data correspond to usage on the plateform after 2015. The current usage metrics is available 48-96 hours after online publication and is updated daily on week days.
Initial download of the metrics may take a while.