Fig. 3
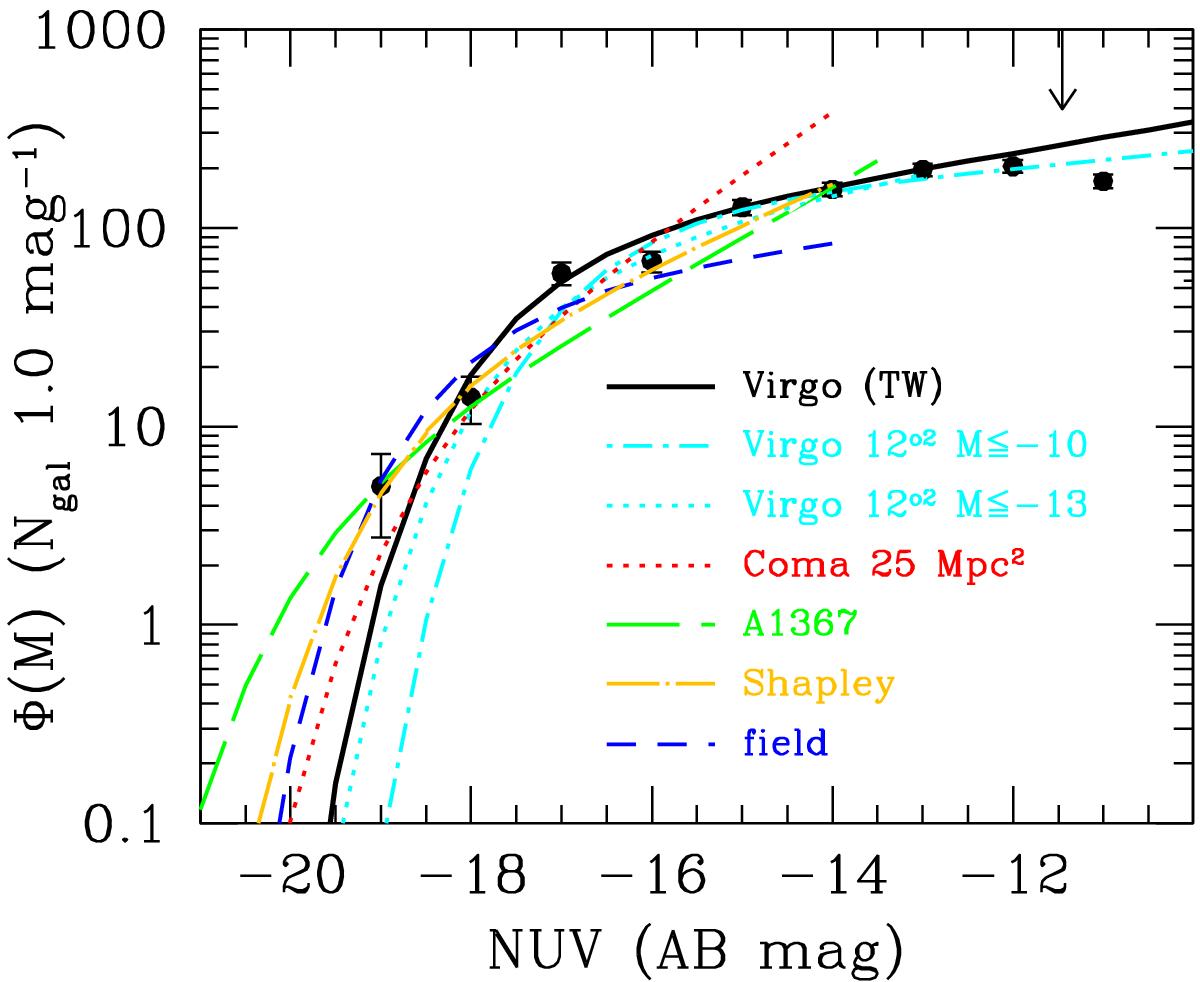
NUV luminosity function of the Virgo cluster (filled dots). The best fit Schechter function (black solid line) is compared to that determined for the central 12 deg2 of the cluster by Boselli et al. (2011) at a limiting absolute magnitude of NUV ≤ −10 (cyan dot-dashed line) and NUV ≤ −13 (cyan dotted line), and to that of the Coma cluster (red dotted line, from Cortese et al. 2008), A1367 (green long-dashed line, Cortese et al. 2005), Shapley supercluster (orange dot-dashed line; Haines et al. 2011) and the field (blue dashed line, Wyder et al. 2005). The different luminosity functions have been normalised to approximately the same number of objects above the completeness limit of each cluster for a fair comparison. The vertical arrow shows the completeness limit of the present survey (NUV = −11.45).
Current usage metrics show cumulative count of Article Views (full-text article views including HTML views, PDF and ePub downloads, according to the available data) and Abstracts Views on Vision4Press platform.
Data correspond to usage on the plateform after 2015. The current usage metrics is available 48-96 hours after online publication and is updated daily on week days.
Initial download of the metrics may take a while.