Fig. 2
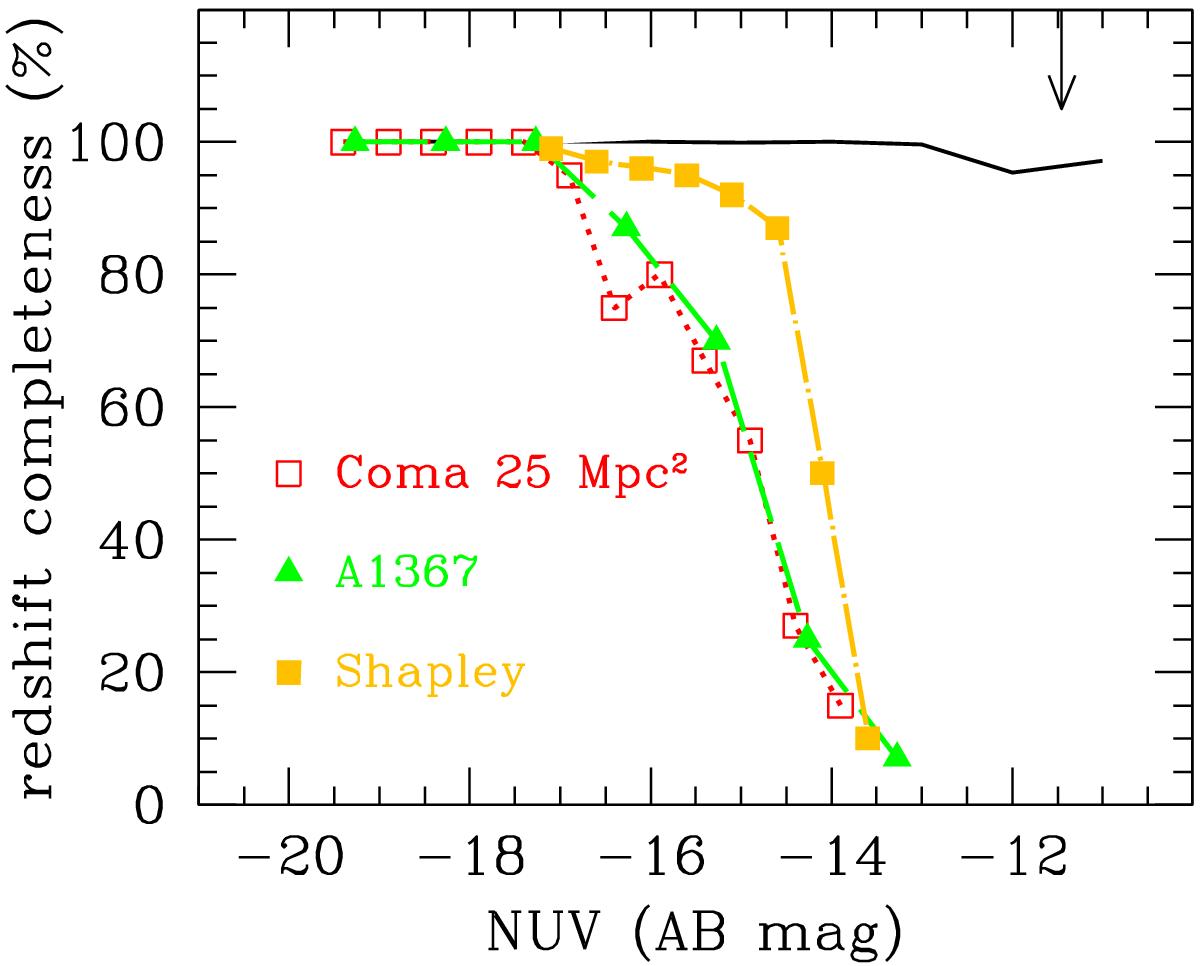
NUV redshift completeness of the GUViCS sample compared to that of Coma (red open squares; Cortese et al. 2008), A1367 (green filled triangles; Cortese et al. 2005), and Shapley supercluster (orange filled squares; Haines et al. 2011). The vertical arrow shows the photometric completeness limit of the present survey (NUV = −11.45).
Current usage metrics show cumulative count of Article Views (full-text article views including HTML views, PDF and ePub downloads, according to the available data) and Abstracts Views on Vision4Press platform.
Data correspond to usage on the plateform after 2015. The current usage metrics is available 48-96 hours after online publication and is updated daily on week days.
Initial download of the metrics may take a while.