Fig. 10
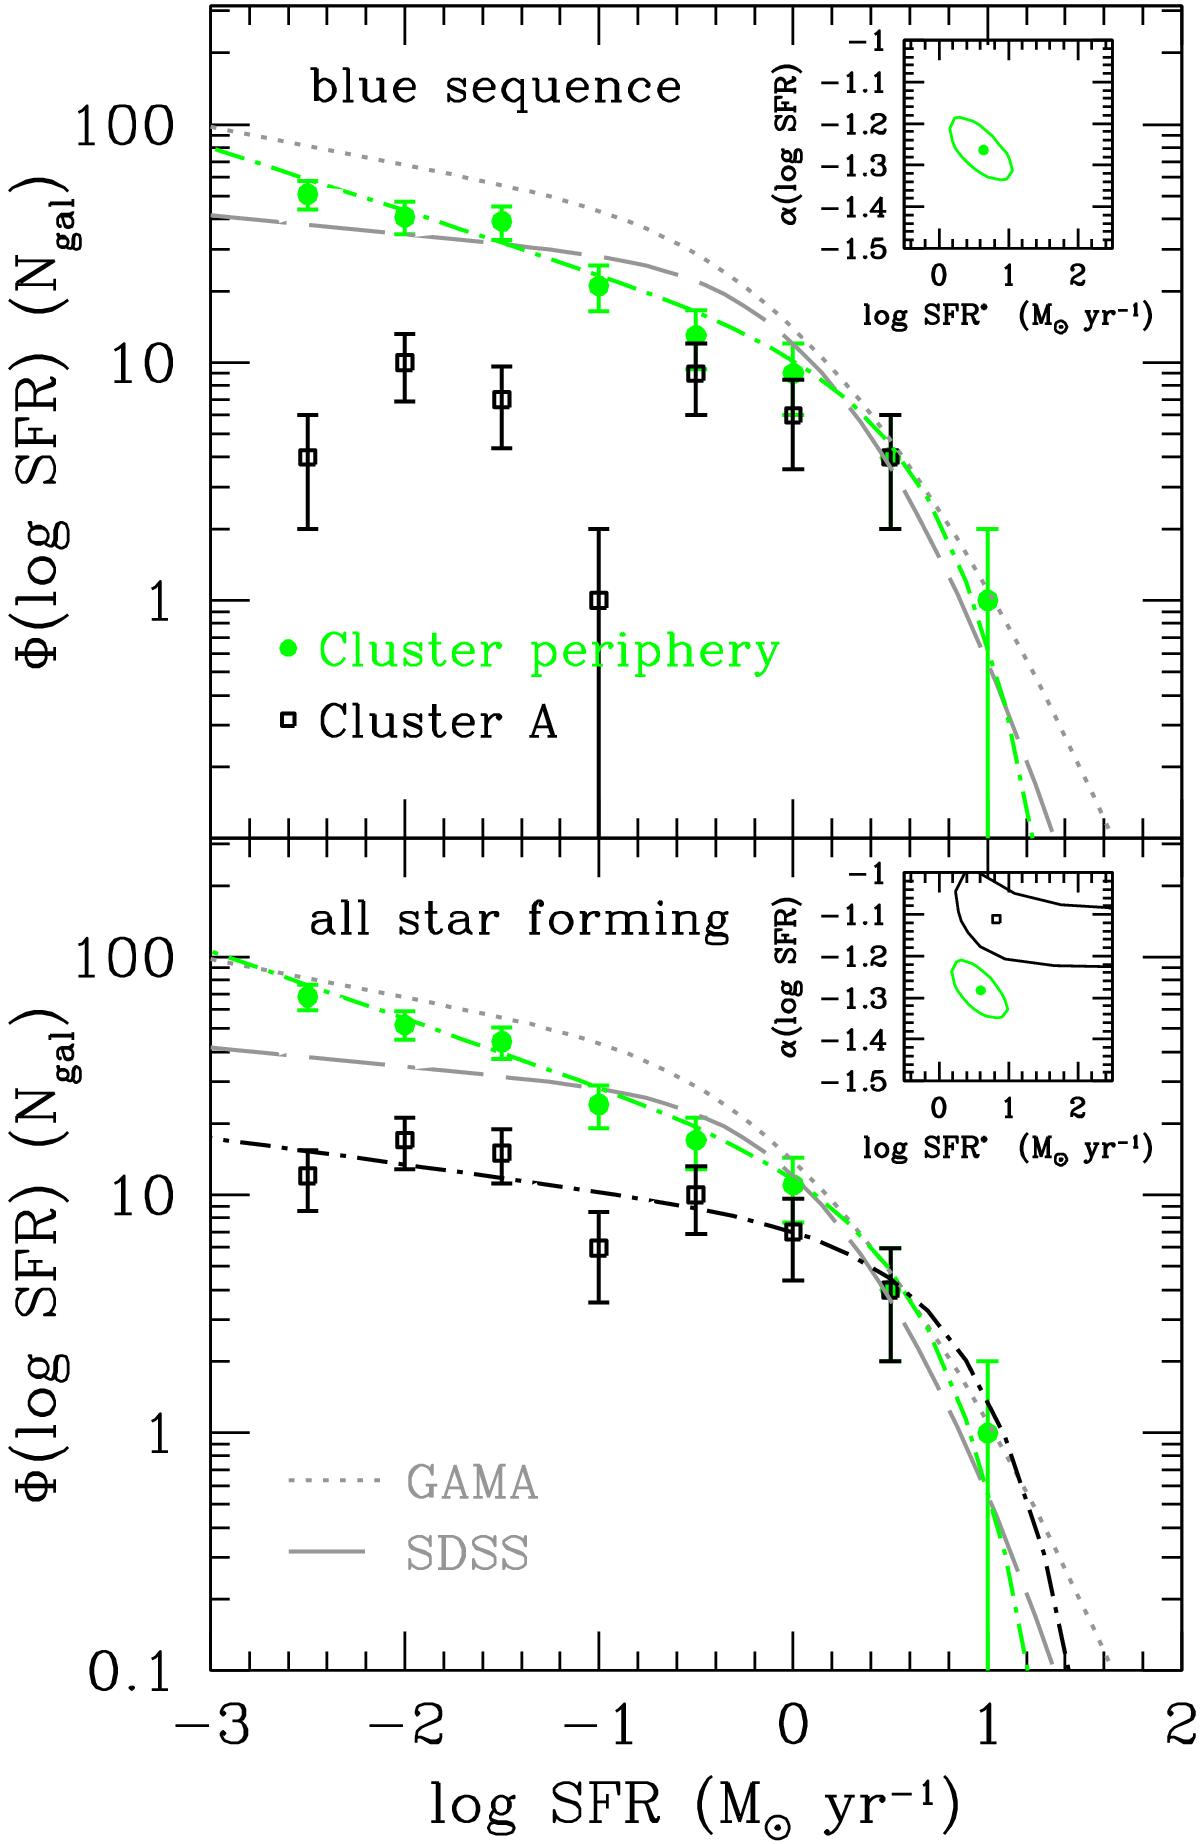
SFR luminosity function of galaxies in the cluster periphery (green filled dots) and in cluster A (black empty squares) derived from the NUV luminosity function of galaxies in the blue sequence (upper panel) and of all star forming objects, including those in the green valley (lower panel). These SFR luminosity functions (green dot-dashed lines for the periphery and black for cluster A) are compared to those derived by Gunawardhana et al. (2013) for the GAMA (grey dotted line) and the SDSS (grey long dashed line) samples. The different luminosity functions have been normalised to approximately the same number of objects for comparison. The small panels in the top right indicate the 1 sigma probability distribution of the fitted Schecheter function parameters.
Current usage metrics show cumulative count of Article Views (full-text article views including HTML views, PDF and ePub downloads, according to the available data) and Abstracts Views on Vision4Press platform.
Data correspond to usage on the plateform after 2015. The current usage metrics is available 48-96 hours after online publication and is updated daily on week days.
Initial download of the metrics may take a while.