Fig. 4
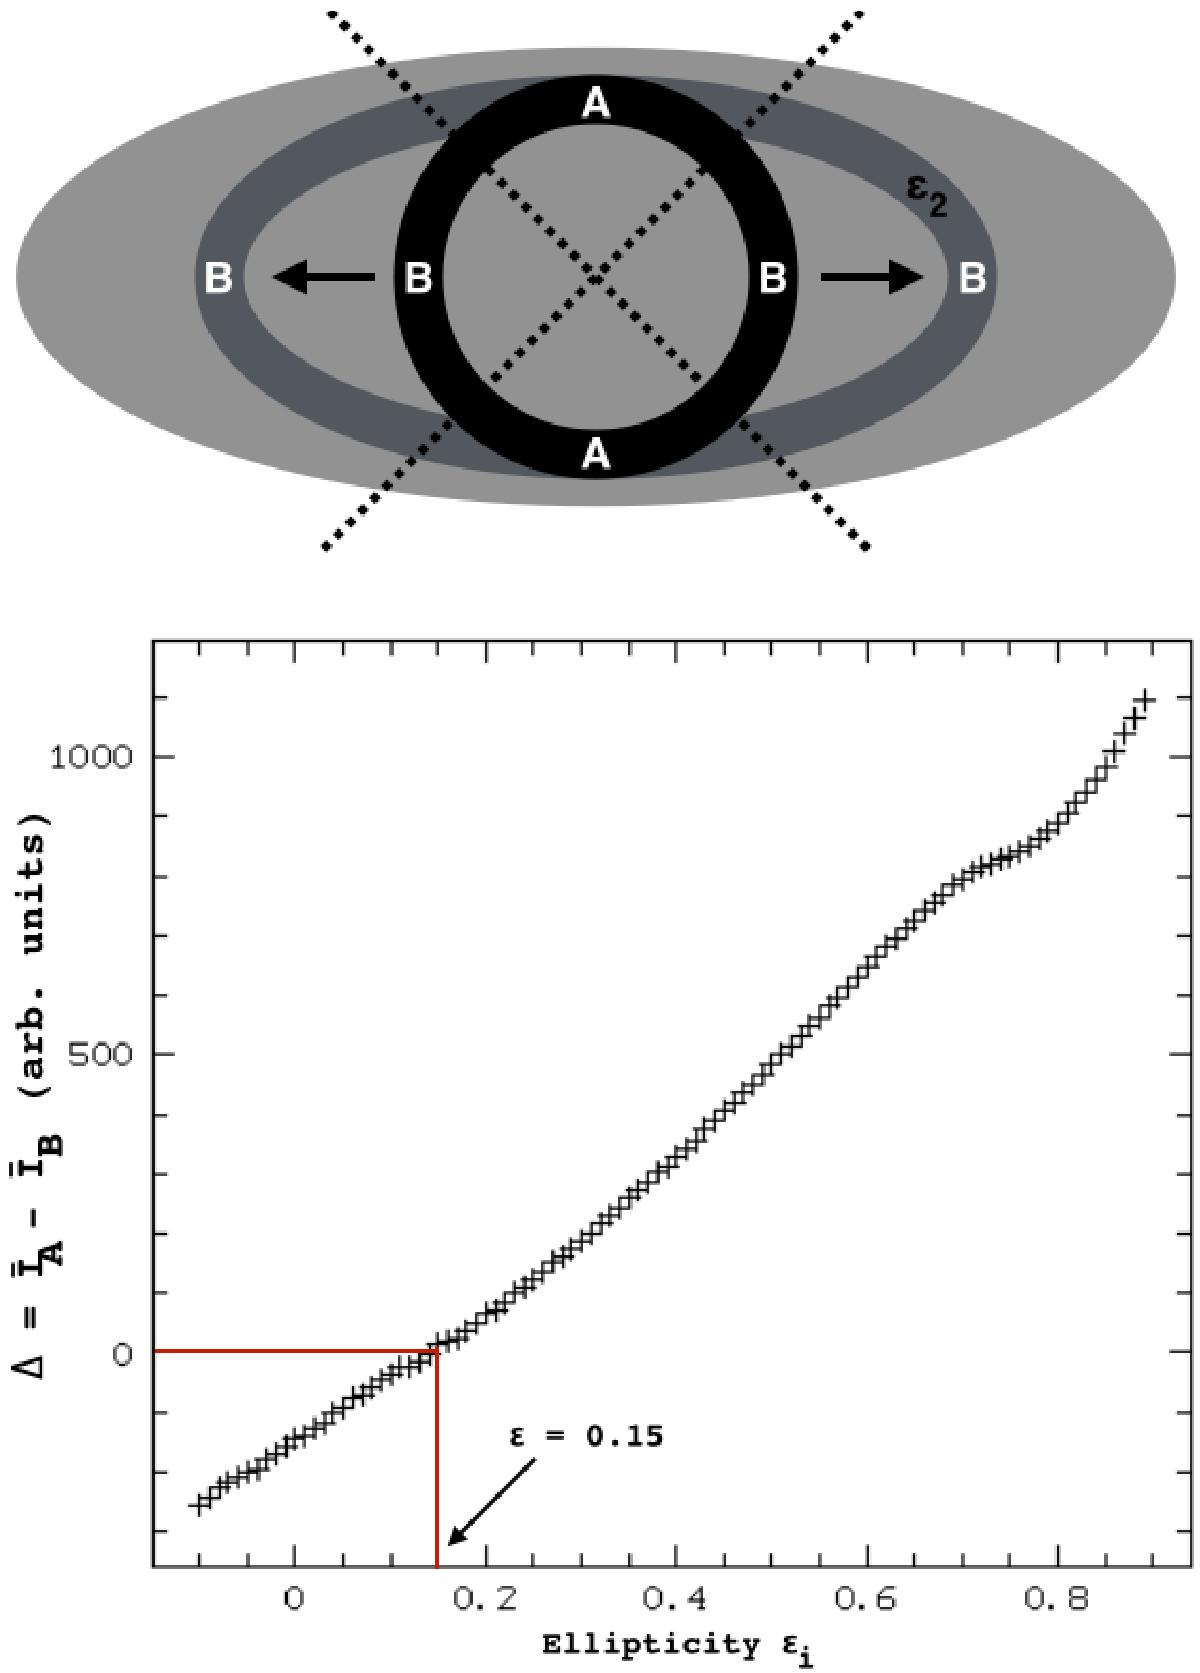
Top panel: sketch of the ellipticity measurement method. The grey area sketches the luminosity distribution of the galaxy. The thick rings and dotted lines represent the ring-shaped masks, split into quadrants, defining two zones, labelled A and B. The ellipticity of the mask is incremented from ε1 to ε2. For each εi, the average intensities in zones A and B, ![]() and
and ![]() , are computed, as well as their difference Δ. Bottom panel: plot of Δ versus εi for one of the data frames of HE0435-1223 as an example. The value of εi for which Δ = 0 indicates the ellipticity of the galaxy.
, are computed, as well as their difference Δ. Bottom panel: plot of Δ versus εi for one of the data frames of HE0435-1223 as an example. The value of εi for which Δ = 0 indicates the ellipticity of the galaxy.
Current usage metrics show cumulative count of Article Views (full-text article views including HTML views, PDF and ePub downloads, according to the available data) and Abstracts Views on Vision4Press platform.
Data correspond to usage on the plateform after 2015. The current usage metrics is available 48-96 hours after online publication and is updated daily on week days.
Initial download of the metrics may take a while.