Fig. 3
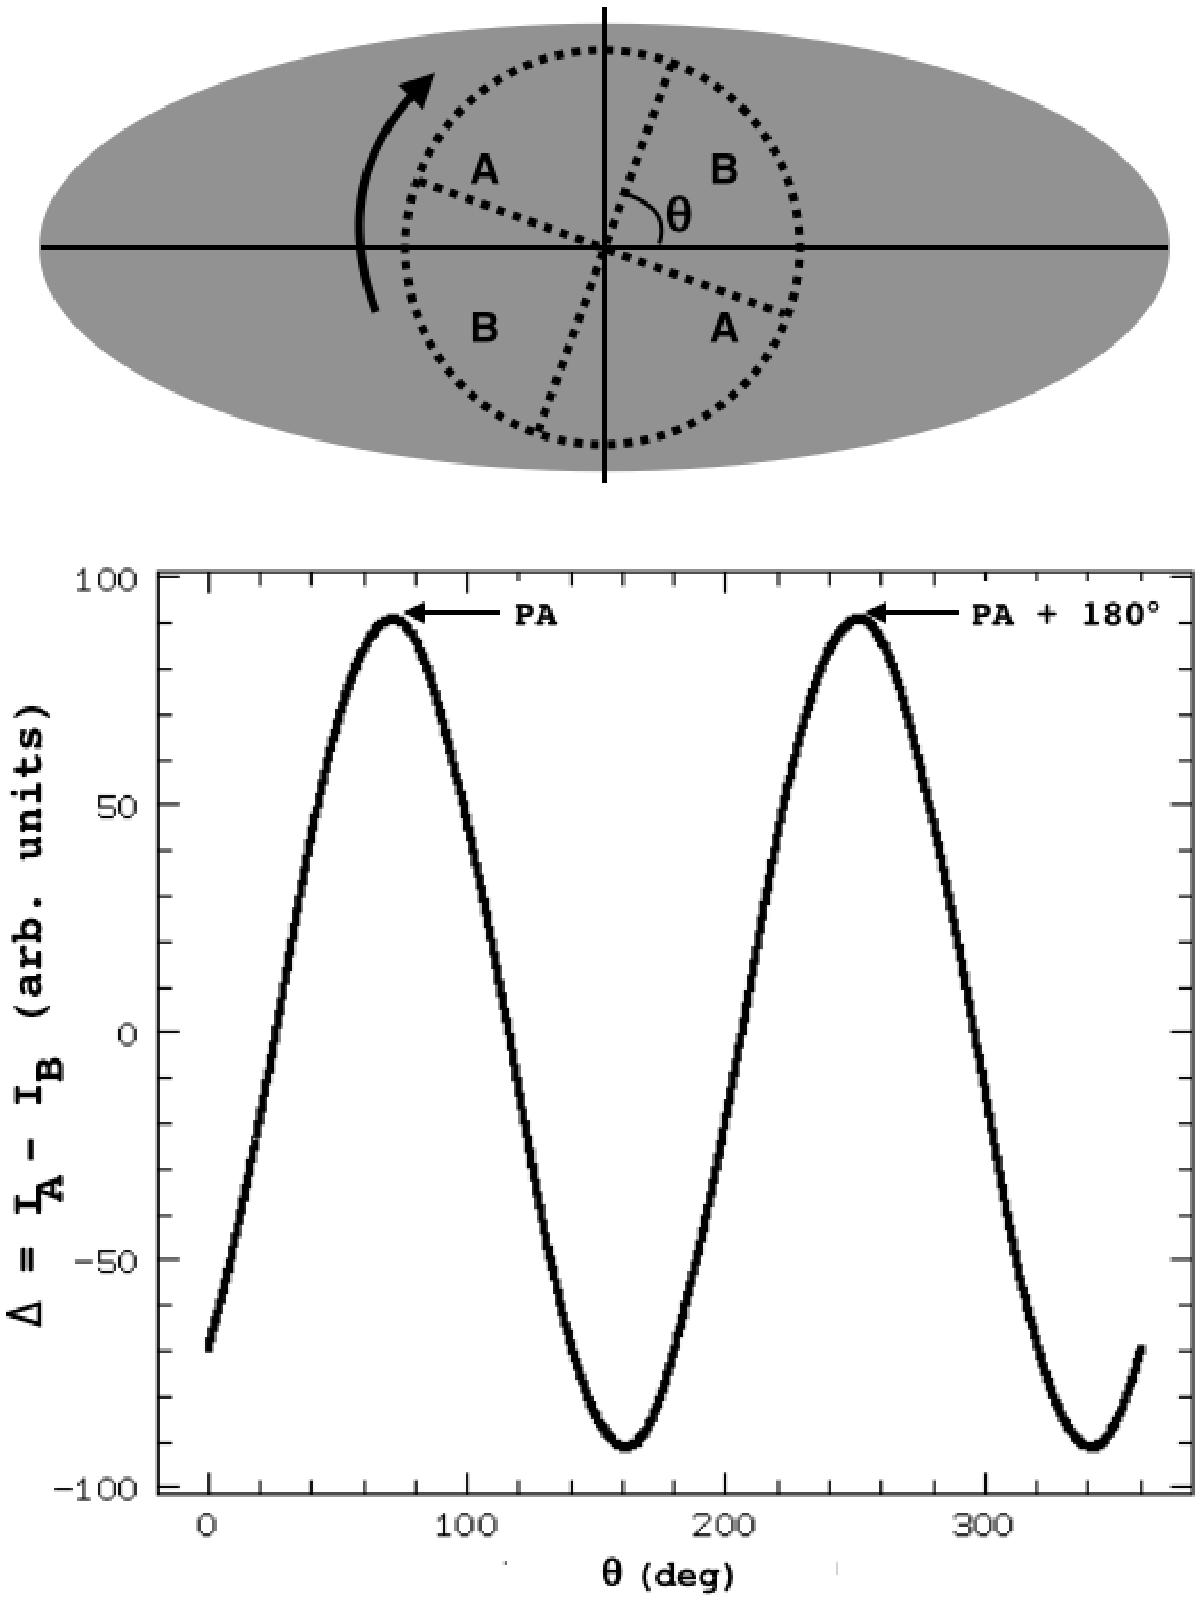
Top panel: sketch of the PA measurement method. The grey area sketches an elliptical luminosity distribution. The dotted circle and lines picture four quadrant-shaped masks defining two zones, labelled A and B. The mask rotates around its centre. For each angle θ between the axis of the mask and the semi-major axis of the galaxy, the total intensity IA and IB are computed within each couple of quadrants, as well as their difference Δ. Bottom panel: plot of Δ versus θ for one of the data frames of HE0435-1223 as an example. The value of θ for which Δ reaches a maximum indicates the PA of the galaxy. The second maximum is redundant, 180° further.
Current usage metrics show cumulative count of Article Views (full-text article views including HTML views, PDF and ePub downloads, according to the available data) and Abstracts Views on Vision4Press platform.
Data correspond to usage on the plateform after 2015. The current usage metrics is available 48-96 hours after online publication and is updated daily on week days.
Initial download of the metrics may take a while.