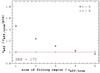
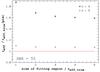
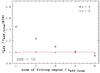
Fig. 8
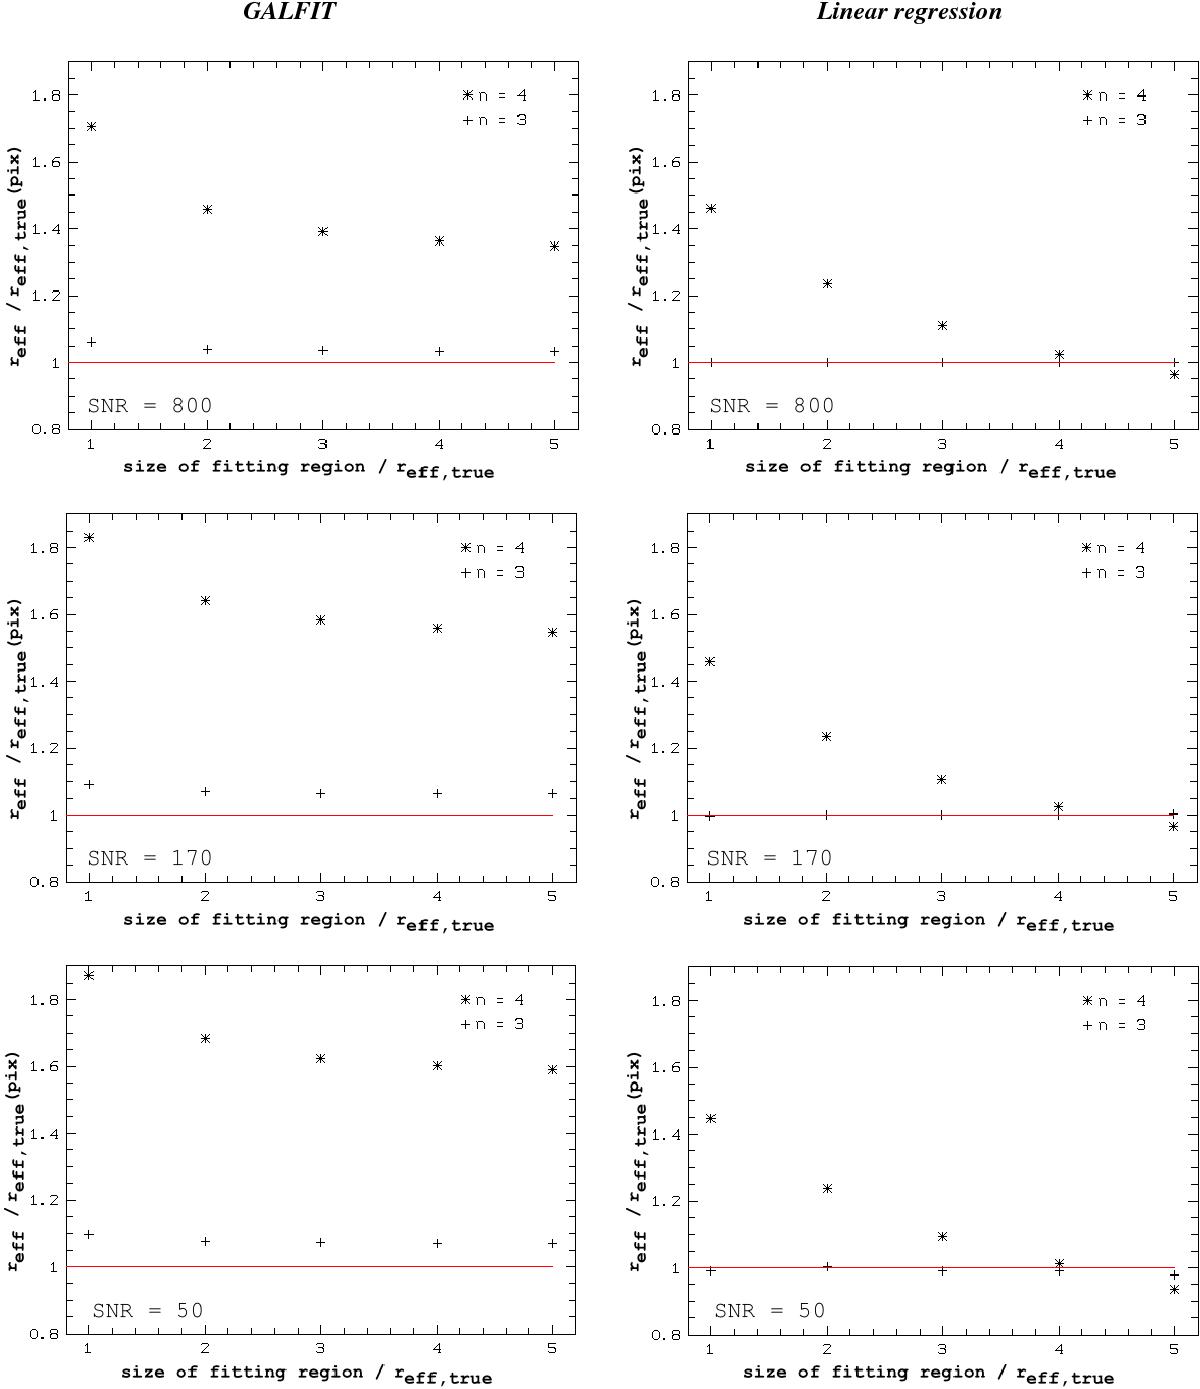
Results of the measurement of reff/reff,true by GALFIT and the linear regression method, as a function of the size of the fitting area, for various S/N. The simulated galaxy is a Sérsic profile with n = 3 and a half-light radius of 10 pixels. The left-hand panels show the result from GALFIT, and the right-hand panel from the linear regression method. The top panels correspond to S/N = 800, the middle panels, S/N = 170, and the bottom panels, S/N = 50. The vertical axis is the measured reff/reff,true. The horizontal line represents reff/reff,true = 1. The horizontal axis shows the size of the fitting region in units of reff,true, ranging from 1 reff,true to 5 reff,true. The stars are the results for n = 4, and the crosses for the correct value n = 3. Because they are smaller than the symbol size, the σrand error bars are not shown in order not to impair the readability of this figure.
Current usage metrics show cumulative count of Article Views (full-text article views including HTML views, PDF and ePub downloads, according to the available data) and Abstracts Views on Vision4Press platform.
Data correspond to usage on the plateform after 2015. The current usage metrics is available 48-96 hours after online publication and is updated daily on week days.
Initial download of the metrics may take a while.