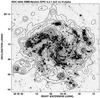
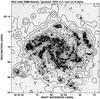
Fig. 1

Left: map of soft X-ray emission from NGC 6946 in the 0.2−1 keV band overlaid onto an Hα image. The contours are 3, 5, 8, 16, 25, 40, 60, 80, 100, 200, 500, and 1000 × rms. The map is adaptively smoothed with the largest scale of 30″. Right: same map, but with point sources excluded from the galactic disk (see text for details).
Current usage metrics show cumulative count of Article Views (full-text article views including HTML views, PDF and ePub downloads, according to the available data) and Abstracts Views on Vision4Press platform.
Data correspond to usage on the plateform after 2015. The current usage metrics is available 48-96 hours after online publication and is updated daily on week days.
Initial download of the metrics may take a while.