Fig. 7
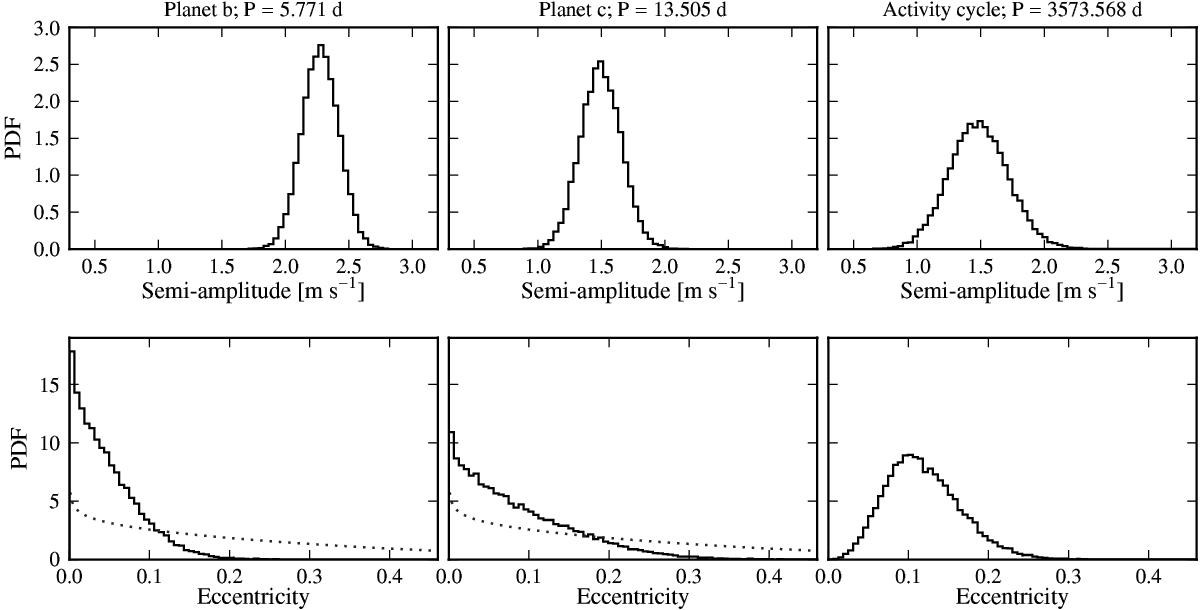
Posterior distributions of the amplitude (top row) and eccentricity (bottom row) of the three Keplerian curves used to model the HARPS radial velocities of HD 1461. The grey dotted curves represent the eccentricity prior for the planetary signals. To facilitate comparison, the axis scales are the same for the three signals.
Current usage metrics show cumulative count of Article Views (full-text article views including HTML views, PDF and ePub downloads, according to the available data) and Abstracts Views on Vision4Press platform.
Data correspond to usage on the plateform after 2015. The current usage metrics is available 48-96 hours after online publication and is updated daily on week days.
Initial download of the metrics may take a while.