Fig. 6
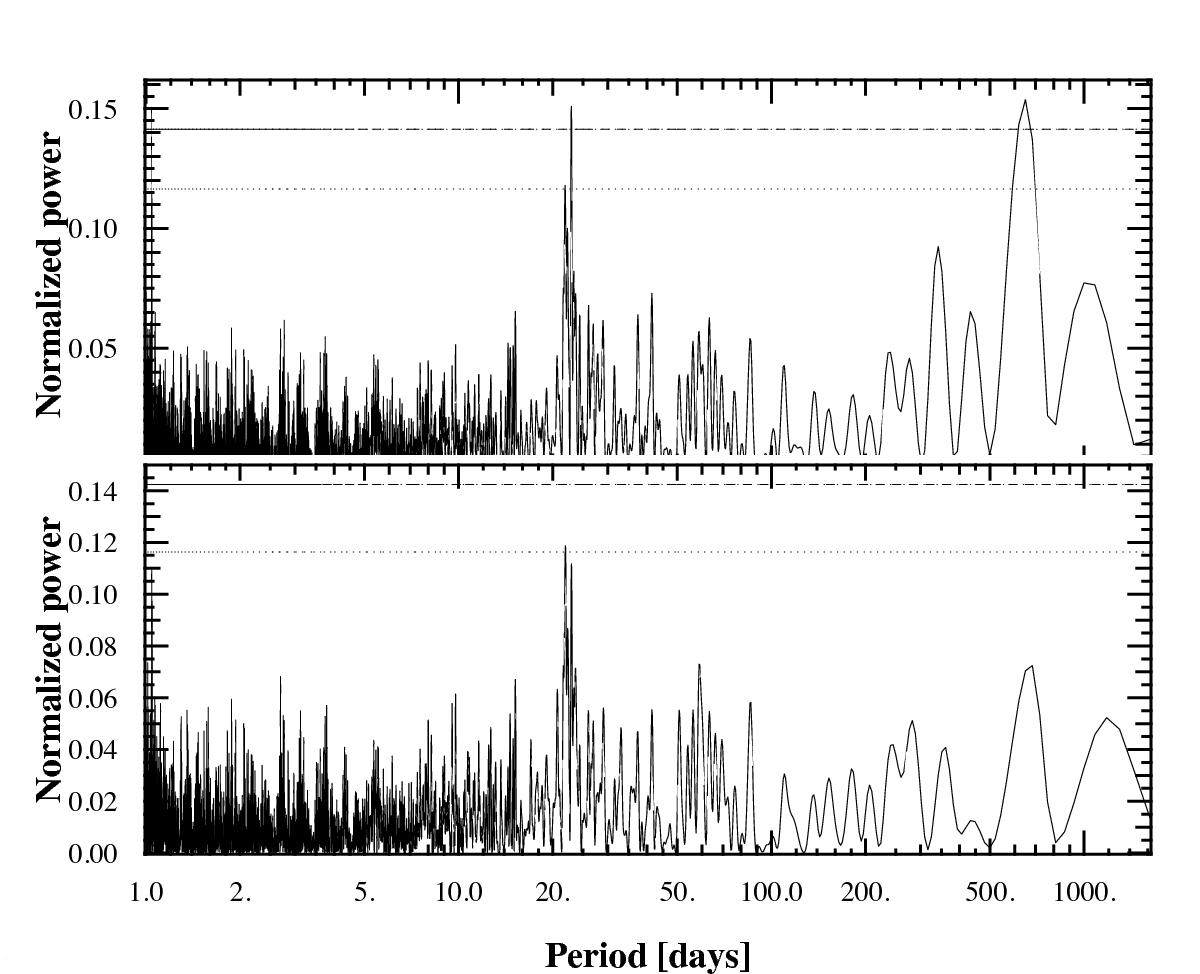
HD 1461. GLS periodogram of the RV residuals of the two-Keplerian model (top) and two-Keplerian + linear drift (bottom) for data taken after JD = 2 454 850 (the inactive data set). The two peaks standing out as significant signals in the top panel have periods of 22.9 days and around 650 days. Note that the significance is reduced drastically when the long-term trend caused by the activity cycle is removed, indicating that the observed periodicities are aliases of a long-period signal present in the data.
Current usage metrics show cumulative count of Article Views (full-text article views including HTML views, PDF and ePub downloads, according to the available data) and Abstracts Views on Vision4Press platform.
Data correspond to usage on the plateform after 2015. The current usage metrics is available 48-96 hours after online publication and is updated daily on week days.
Initial download of the metrics may take a while.