Free Access
Fig. 3
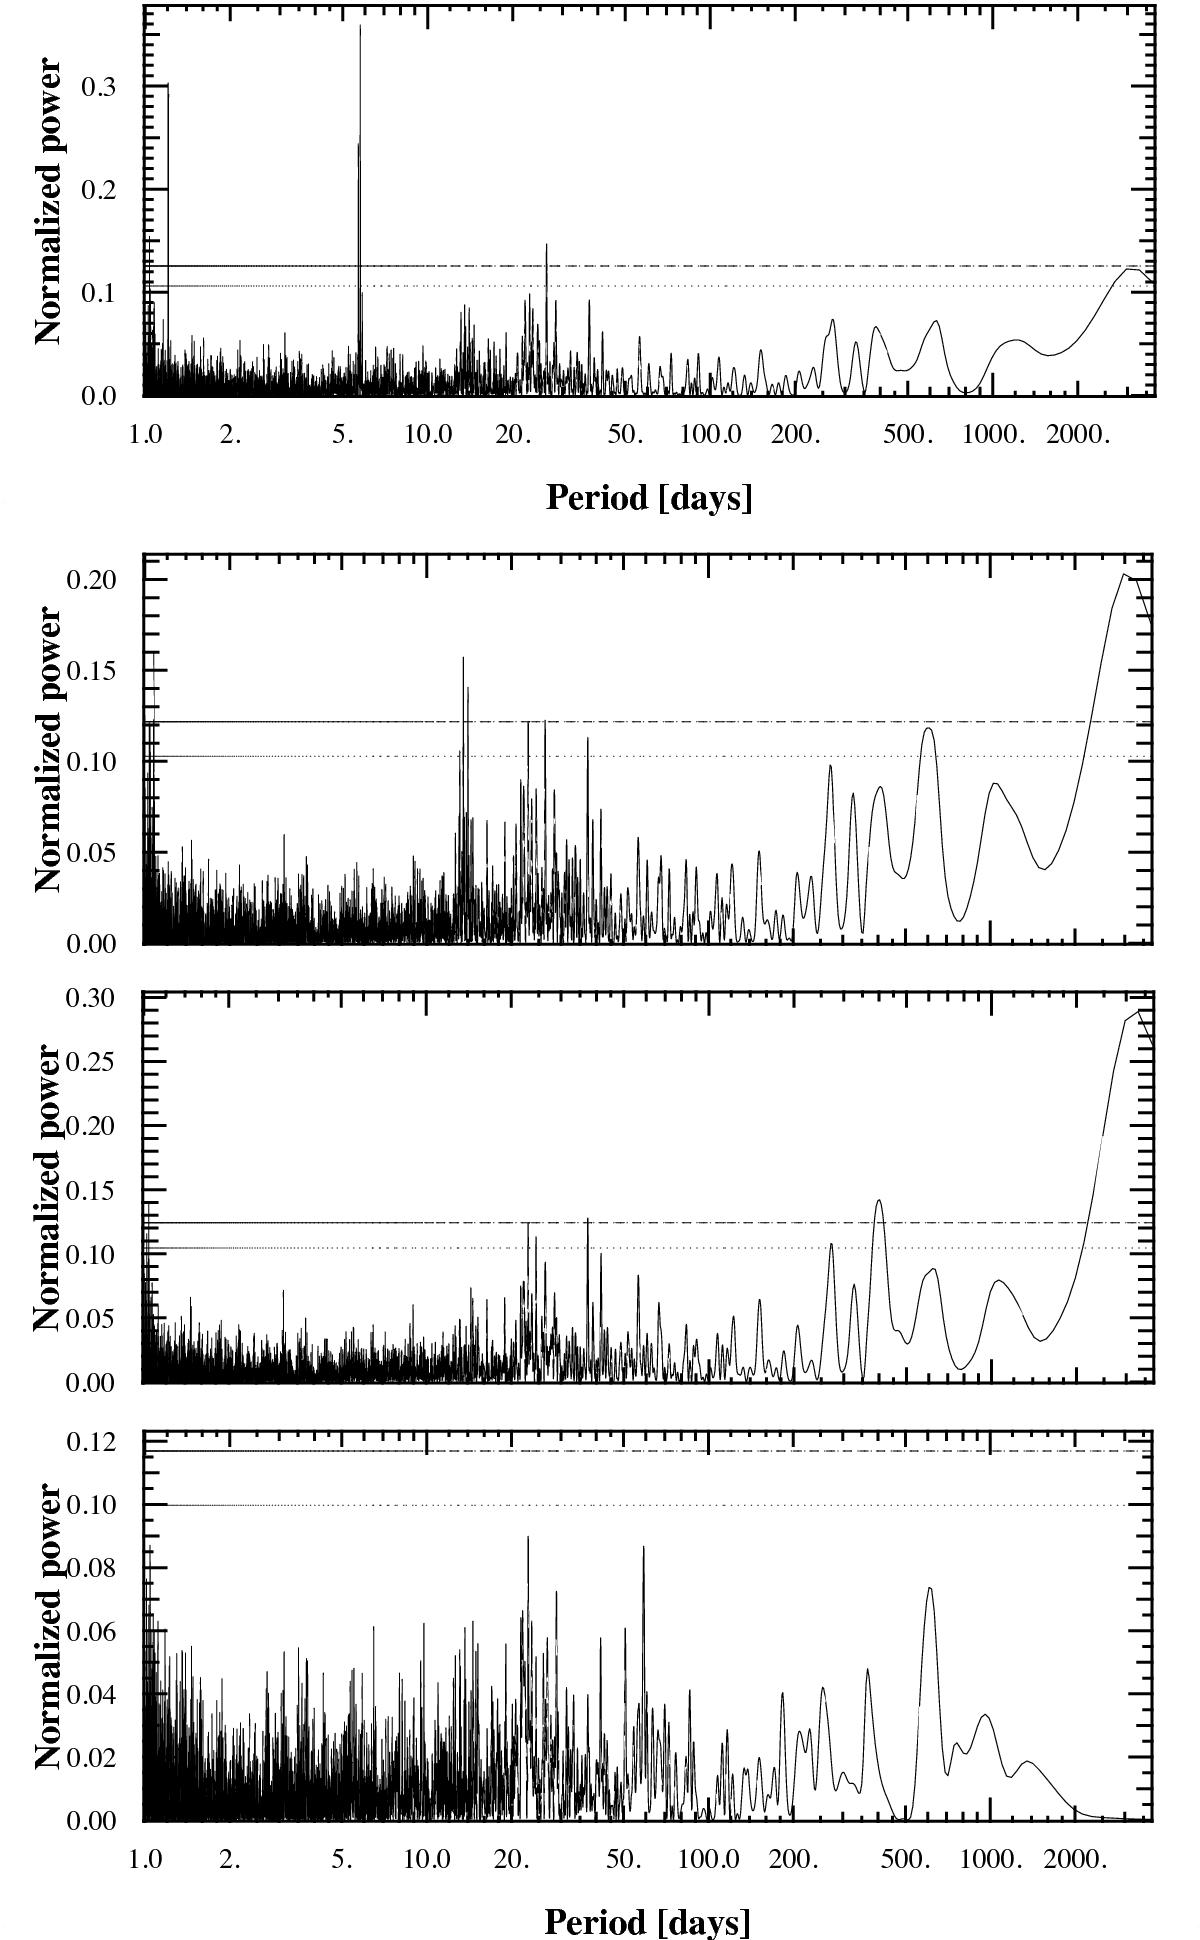
Periodograms of the RV data of HD 1461 (top panel) and residuals around models with 1, 2, and 3 Keplerians. The horizontal lines are the 10% and 1% p-value levels.
This figure is made of several images, please see below:
Current usage metrics show cumulative count of Article Views (full-text article views including HTML views, PDF and ePub downloads, according to the available data) and Abstracts Views on Vision4Press platform.
Data correspond to usage on the plateform after 2015. The current usage metrics is available 48-96 hours after online publication and is updated daily on week days.
Initial download of the metrics may take a while.