Free Access
Fig. 23
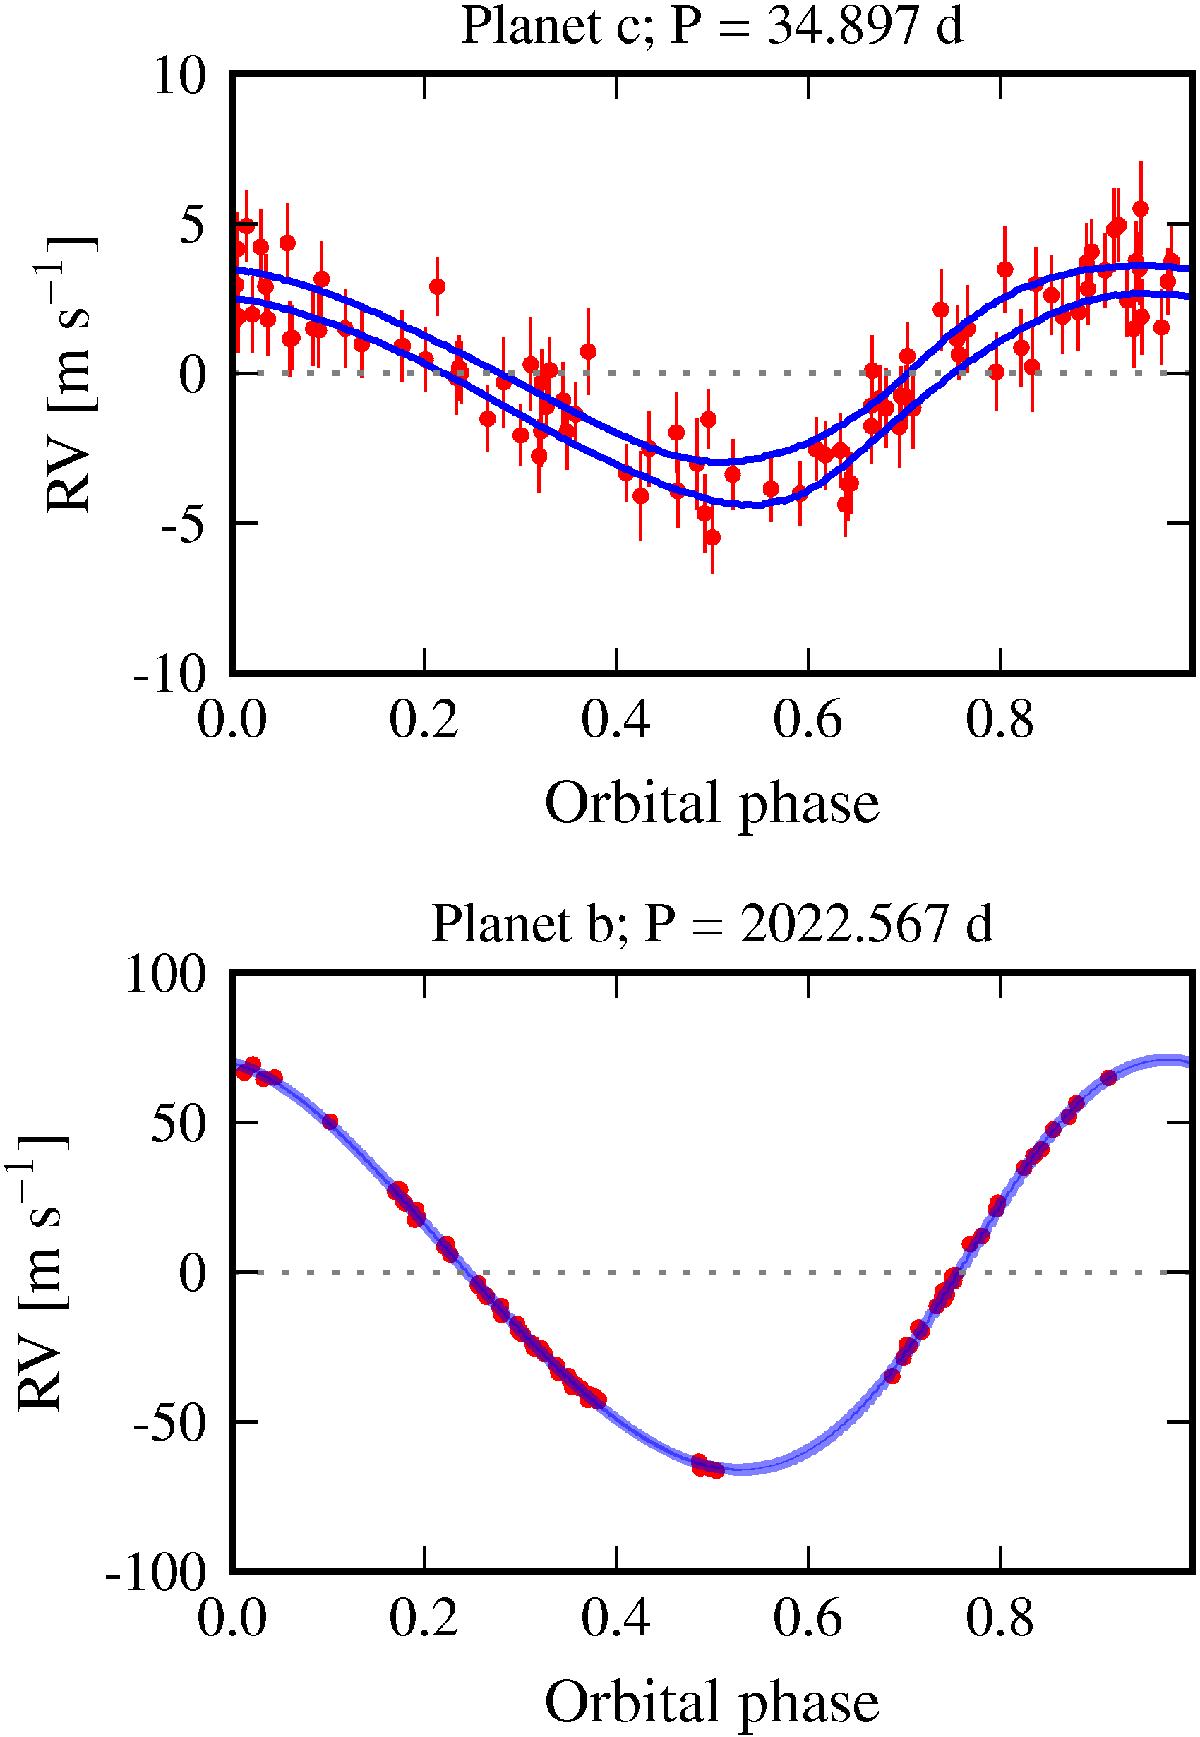
Radial velocity data phase-folded to the best-fit period of each of the two planetary candidates in the HD 204313 system after subtracting the effect of the other signal and the long-term drift. The blue lines represent the 95-% highest density interval (HDI).
Current usage metrics show cumulative count of Article Views (full-text article views including HTML views, PDF and ePub downloads, according to the available data) and Abstracts Views on Vision4Press platform.
Data correspond to usage on the plateform after 2015. The current usage metrics is available 48-96 hours after online publication and is updated daily on week days.
Initial download of the metrics may take a while.