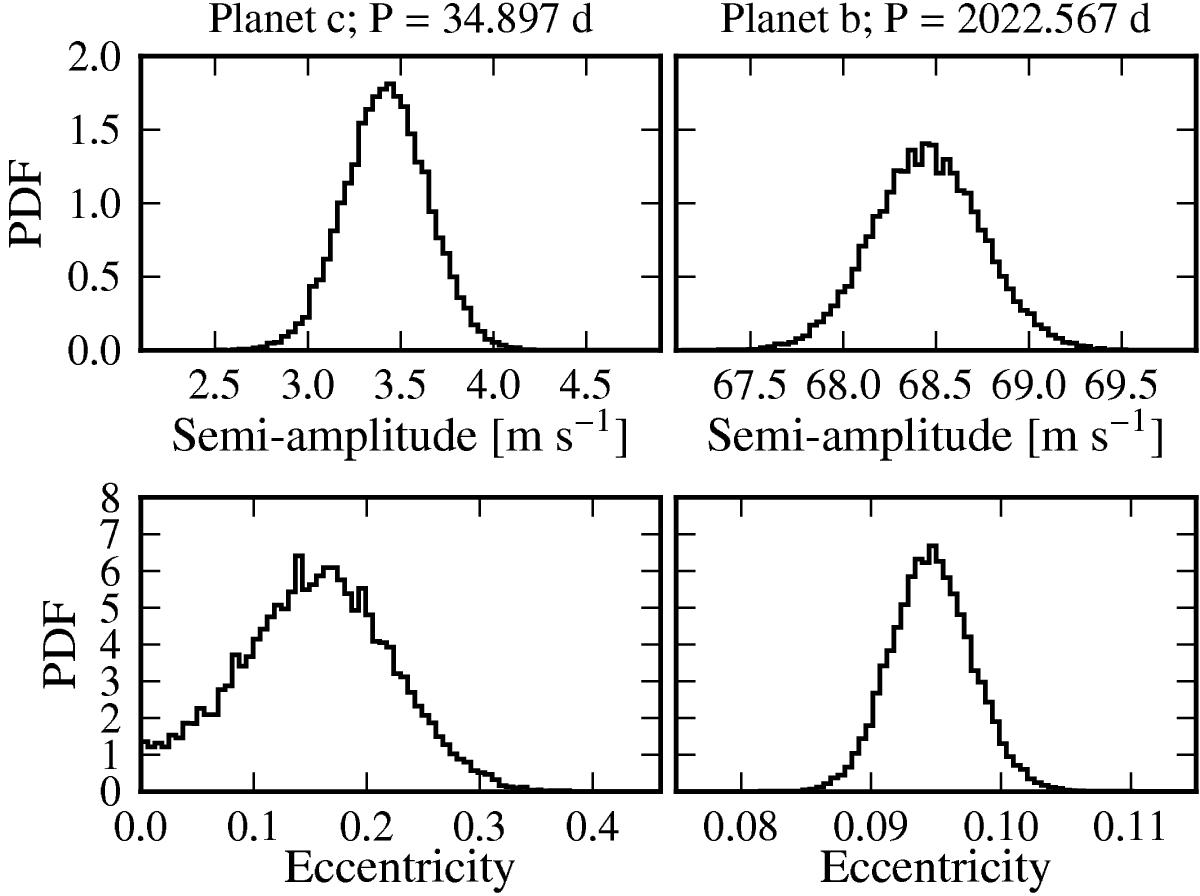
Fig. 22

Posterior distributions of the amplitude (top row) and eccentricity (bottom row) of the two Keplerian curves used to model the HARPS radial velocities of HD 204313. Because the eccentricity distribution of planet b is much more concentrated that the corresponding distribution of planet c, the vertical scale was set to 20 times larger than the scale shown for planet c.
Current usage metrics show cumulative count of Article Views (full-text article views including HTML views, PDF and ePub downloads, according to the available data) and Abstracts Views on Vision4Press platform.
Data correspond to usage on the plateform after 2015. The current usage metrics is available 48-96 hours after online publication and is updated daily on week days.
Initial download of the metrics may take a while.


