Fig. 19
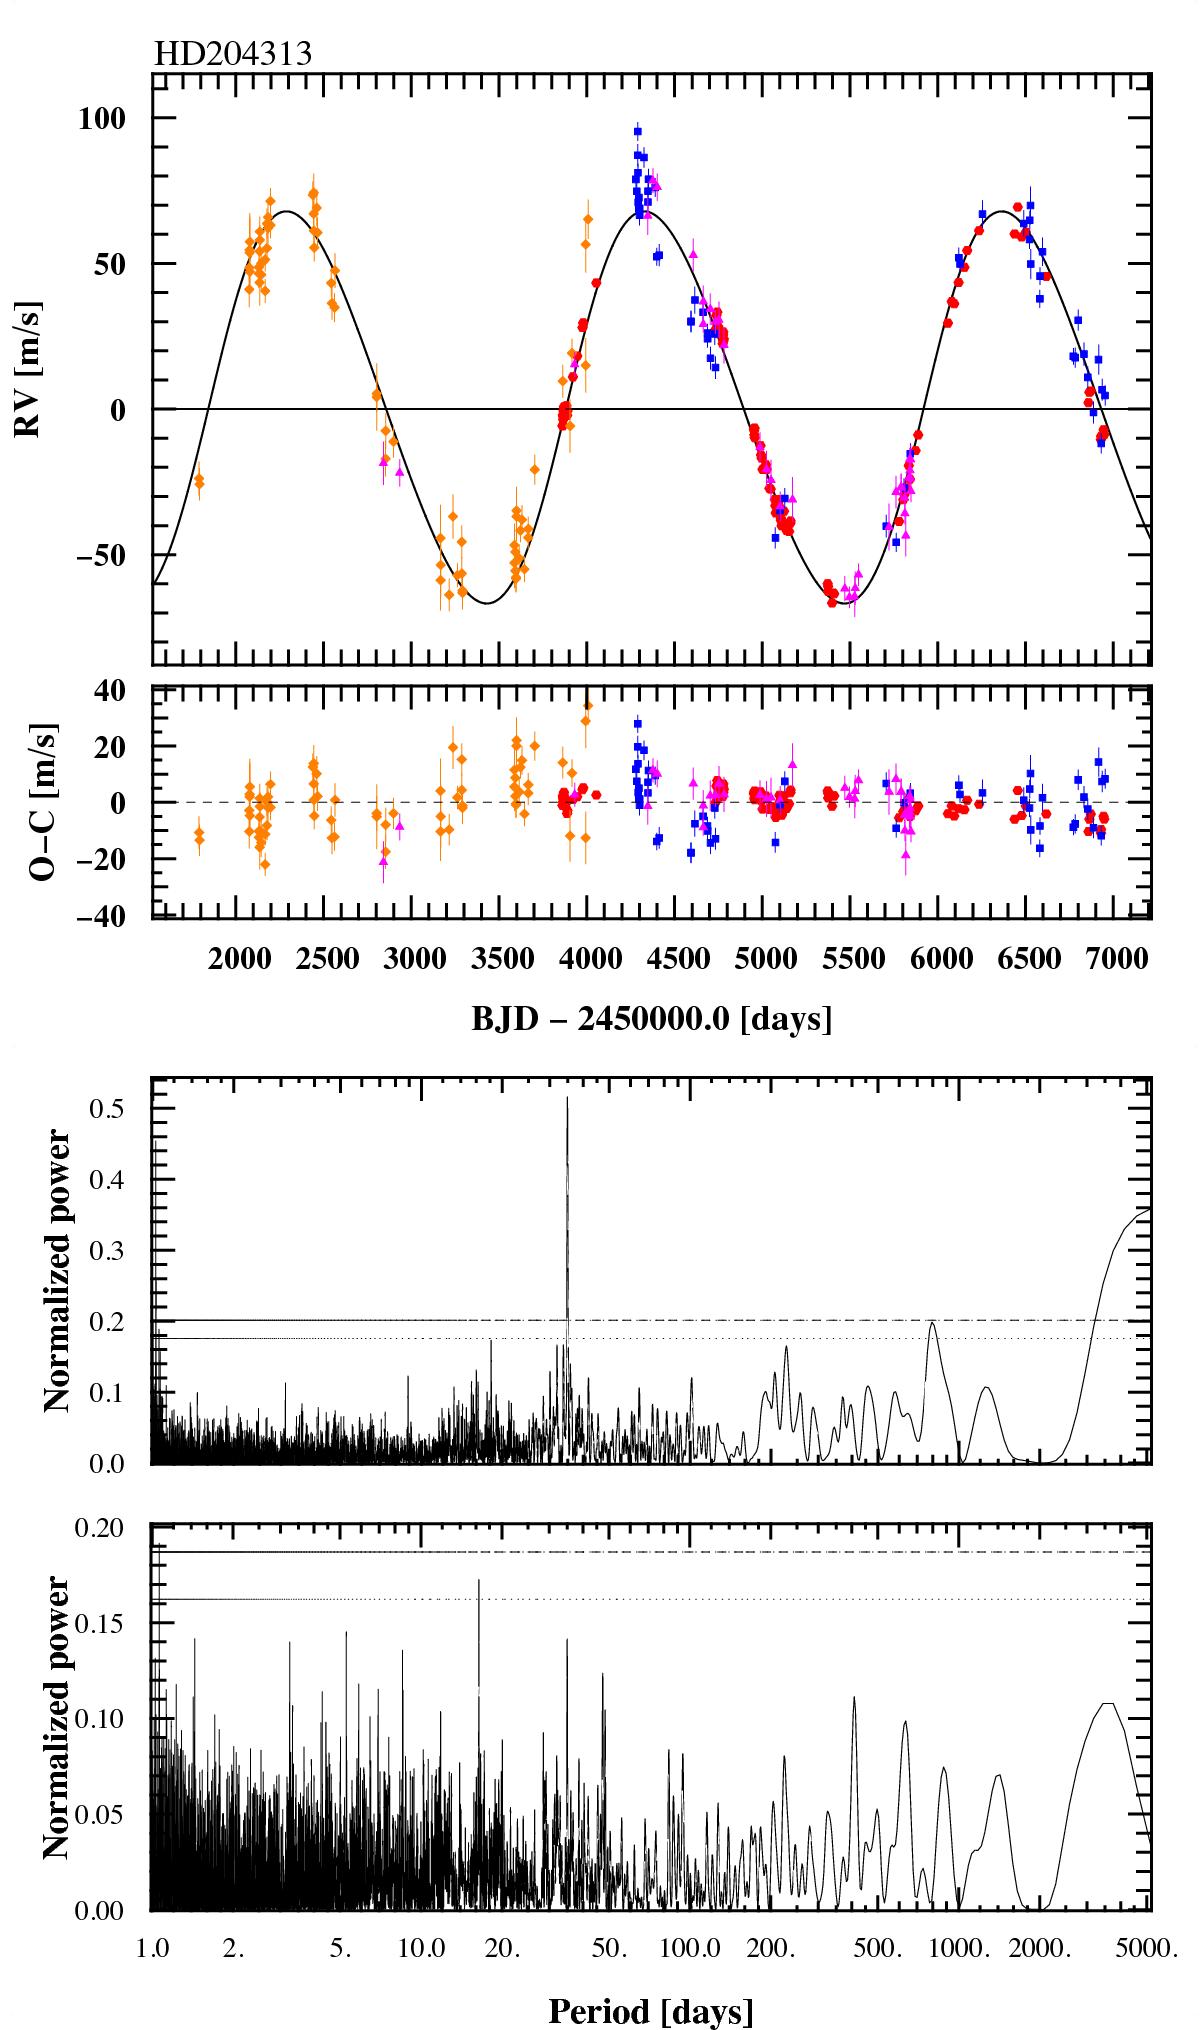
Top: radial velocities of HD 204313 with the corresponding one-Keplerian model. Red points are HARPS data; blue and orange points represent CORALIE07 and CORALIE98 data, respectively; magenta points are the Robertson et al. (2012) McDonald radial velocities. Middle: generalised Lomb-Scargle periodogram of the residuals to the model plotted in the upper panel, exhibiting excess power at P = 34.9 days and a low-frequency trend. The horizontal dotted and dashed lines represent the 10% and 1% p-value levels, respectively. Bottom: GLS periodogram of the RV residuals to the one-Keplerian model without the HARPS data. The peak at 34.9 days is no longer significant, and the long-term trend has been replaced by a definite period at P ~ 3500 days with insignificant power.
Current usage metrics show cumulative count of Article Views (full-text article views including HTML views, PDF and ePub downloads, according to the available data) and Abstracts Views on Vision4Press platform.
Data correspond to usage on the plateform after 2015. The current usage metrics is available 48-96 hours after online publication and is updated daily on week days.
Initial download of the metrics may take a while.