Fig. 18
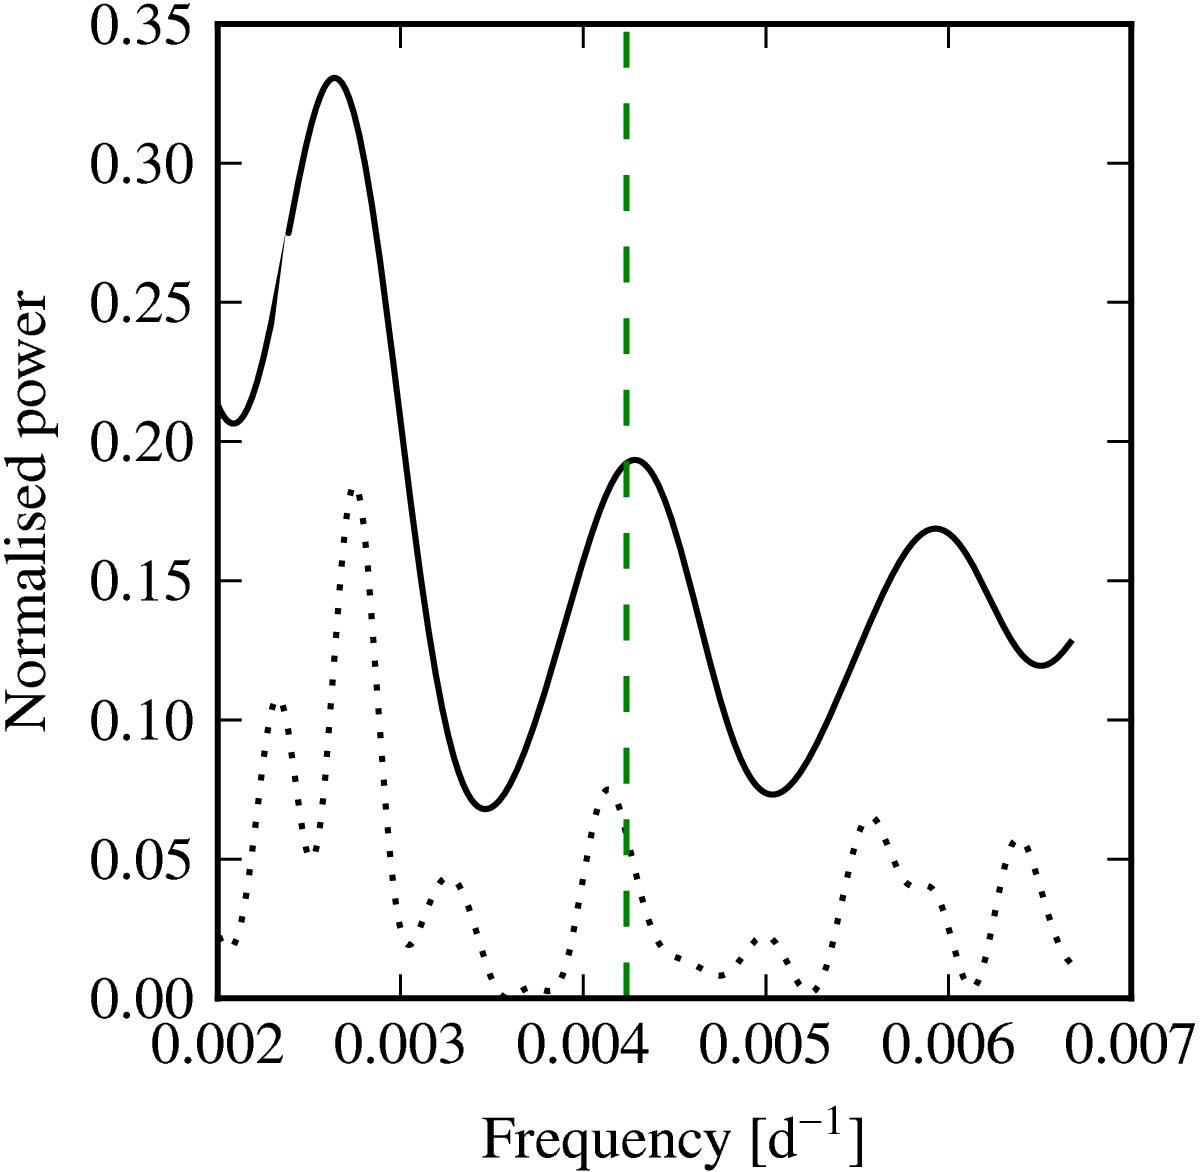
HD 40307. Window function around the one-year alias (0.00273 cycles/day) for the data set used by T13 (solid curve), consisting of the inactive data set plus a few points taken during commissioning. The corresponding spectral window function for the data set analysed here is shown as a dotted curve. The frequency corresponding to 236 days is indicated by the vertical dashed line.
Current usage metrics show cumulative count of Article Views (full-text article views including HTML views, PDF and ePub downloads, according to the available data) and Abstracts Views on Vision4Press platform.
Data correspond to usage on the plateform after 2015. The current usage metrics is available 48-96 hours after online publication and is updated daily on week days.
Initial download of the metrics may take a while.