Fig. 10
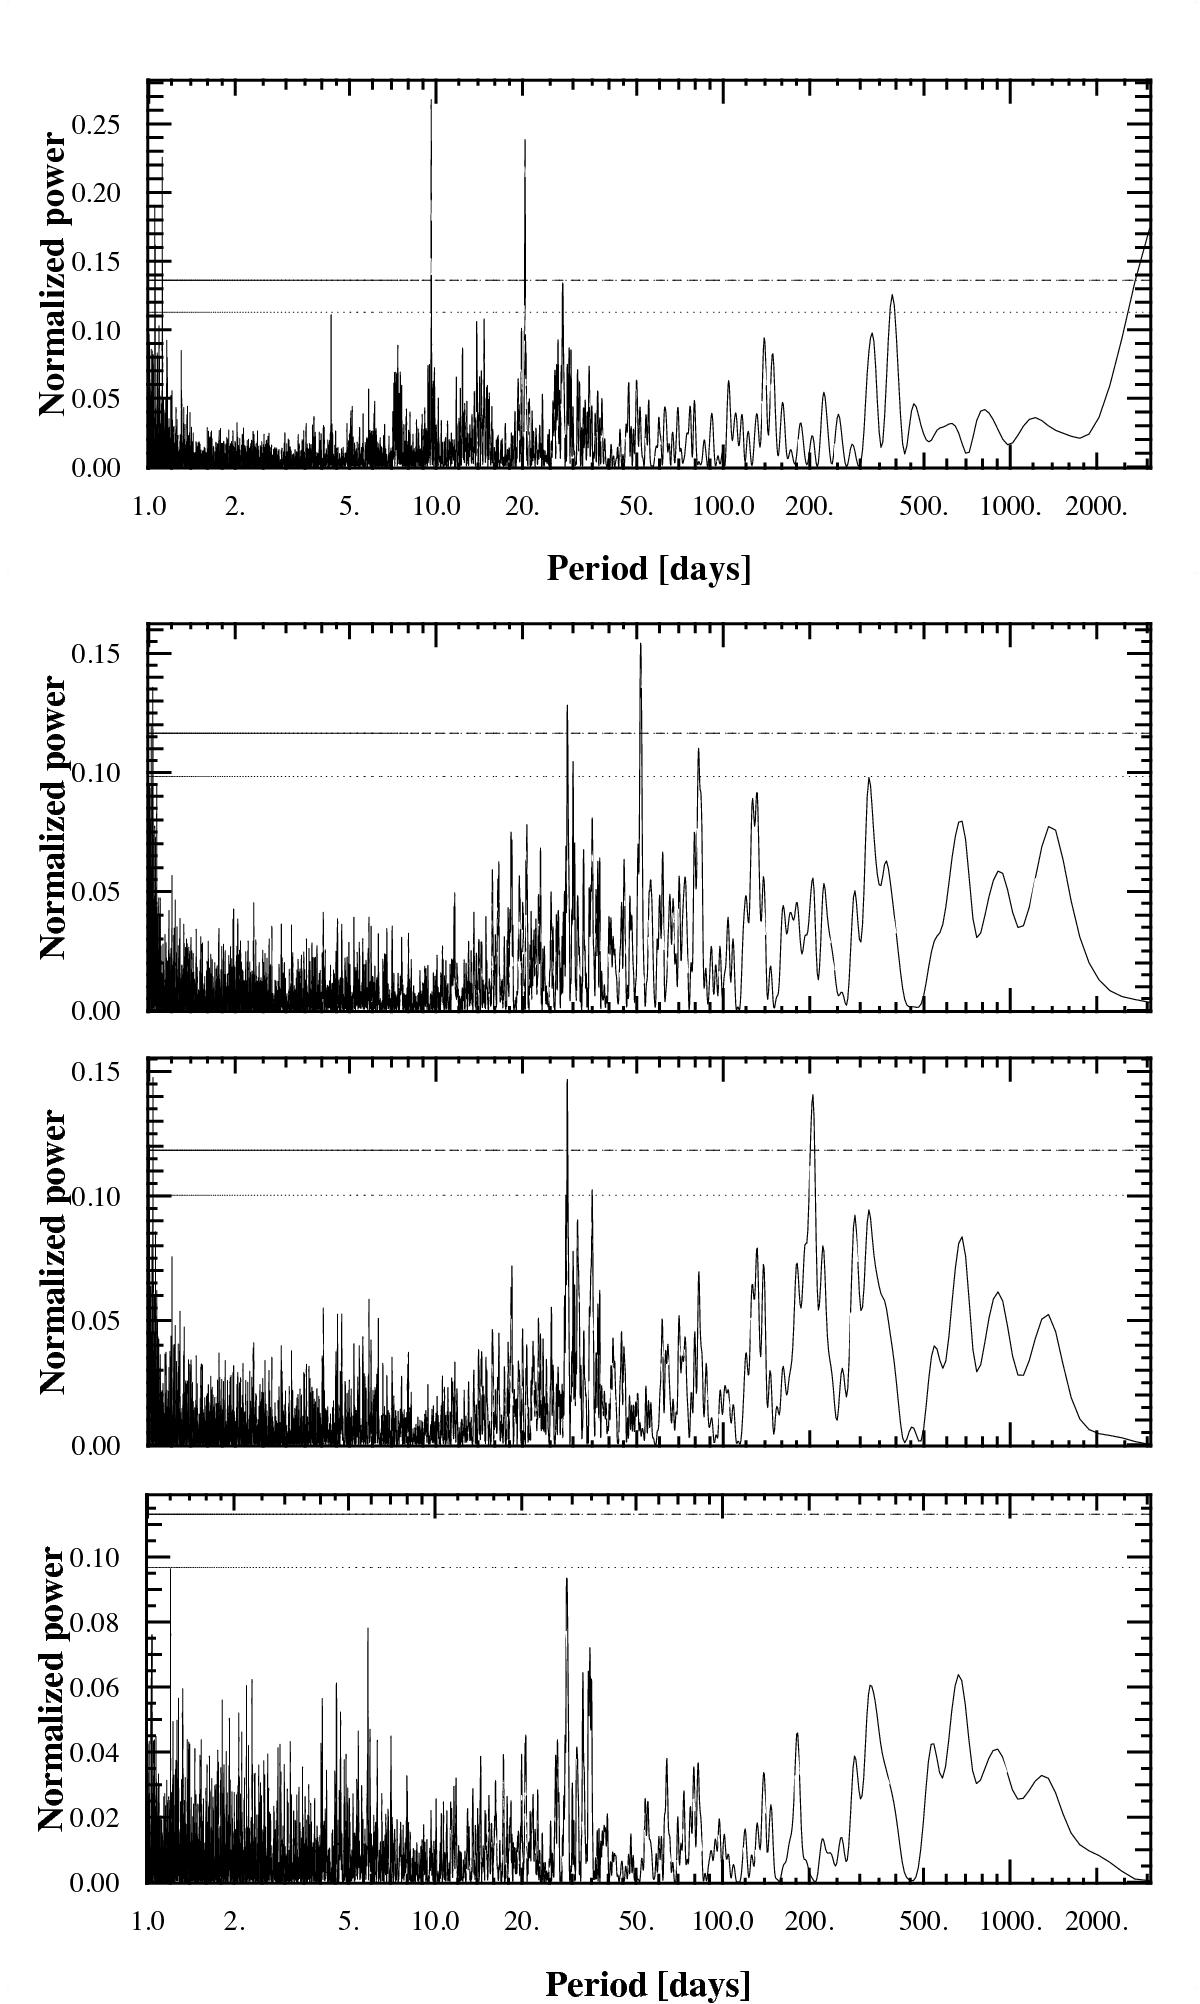
Periodogram of the RV data of HD 40307 (top panel), and of the residuals around models with three (second from top), four (second from bottom), and five (bottom) Keplerian signals in addition to a cubic function to take into account the long-term trend produced by the magnetic cycle of the star. The horizontal dotted and dashed lines represent the 10% and 1% false alarm probability levels, respectively.
Current usage metrics show cumulative count of Article Views (full-text article views including HTML views, PDF and ePub downloads, according to the available data) and Abstracts Views on Vision4Press platform.
Data correspond to usage on the plateform after 2015. The current usage metrics is available 48-96 hours after online publication and is updated daily on week days.
Initial download of the metrics may take a while.