Fig. 3
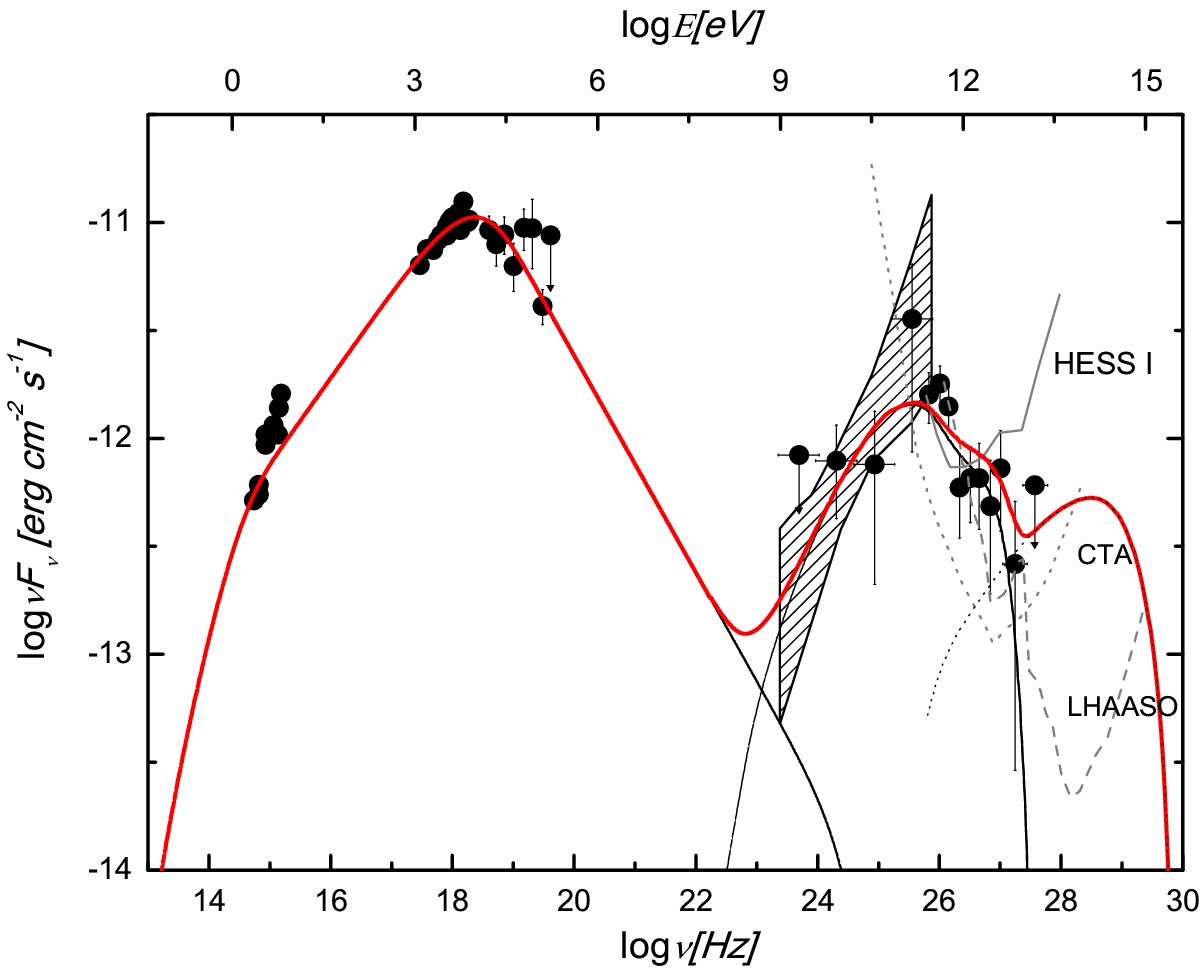
Multiwavelength SED of the distant TeV blazar 1ES 0229+200. The solid black curve represents the internal component spectra with the absorption optical depth that is deduced by the LLL EBL model in Dwek & Krennrich (2005), and the dotted black curve represents the external component spectra. The superposed model spectrum is plotted as a red curve. The observed data come from Aliu et al. (2014) (solid circle). The shaded area shows the Fermi upper bounds at the 99% confidence level. The differential sensitivity curve for the 50-h observation with HESS I3, gray solid curve, the 50-h differential sensitivity goal of the CTA (Actis et al. 2011, gray dashed curve), and the differential sensitivity curve for the one-year observation with LHAASO (Cui et al. 2014, gray dotted curve) are also shown.
Current usage metrics show cumulative count of Article Views (full-text article views including HTML views, PDF and ePub downloads, according to the available data) and Abstracts Views on Vision4Press platform.
Data correspond to usage on the plateform after 2015. The current usage metrics is available 48-96 hours after online publication and is updated daily on week days.
Initial download of the metrics may take a while.