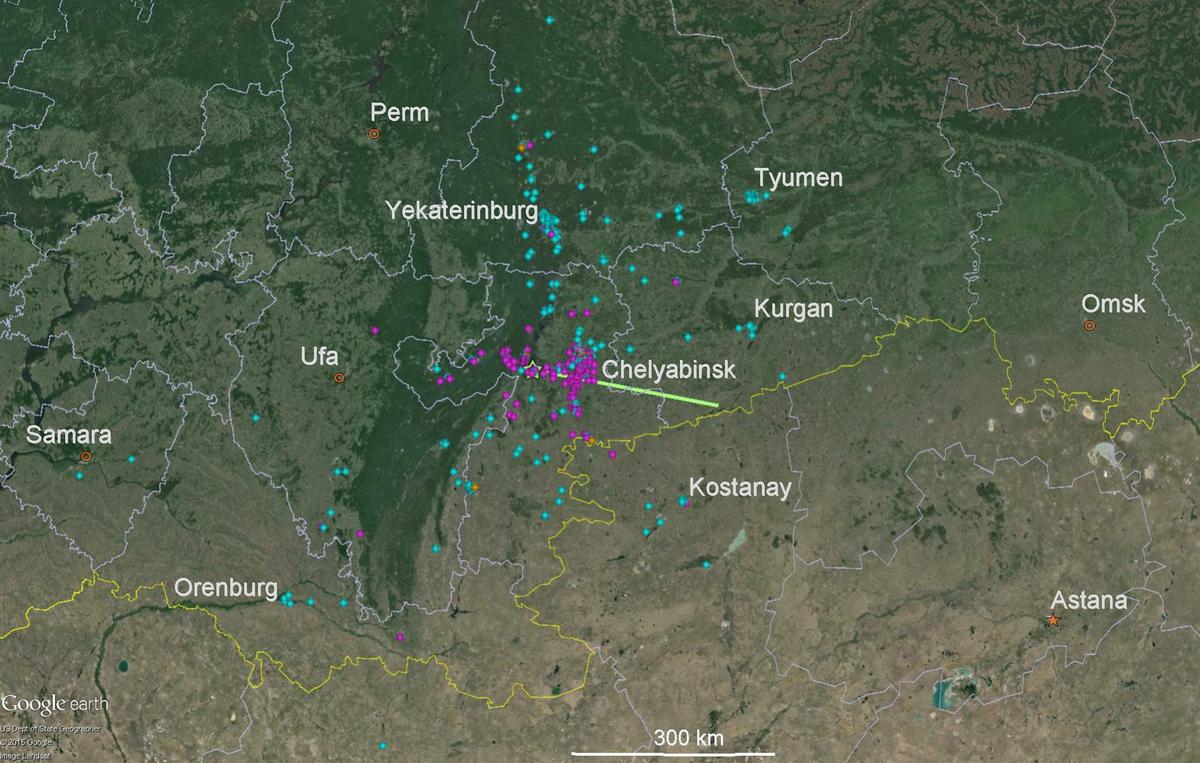
Fig. 2
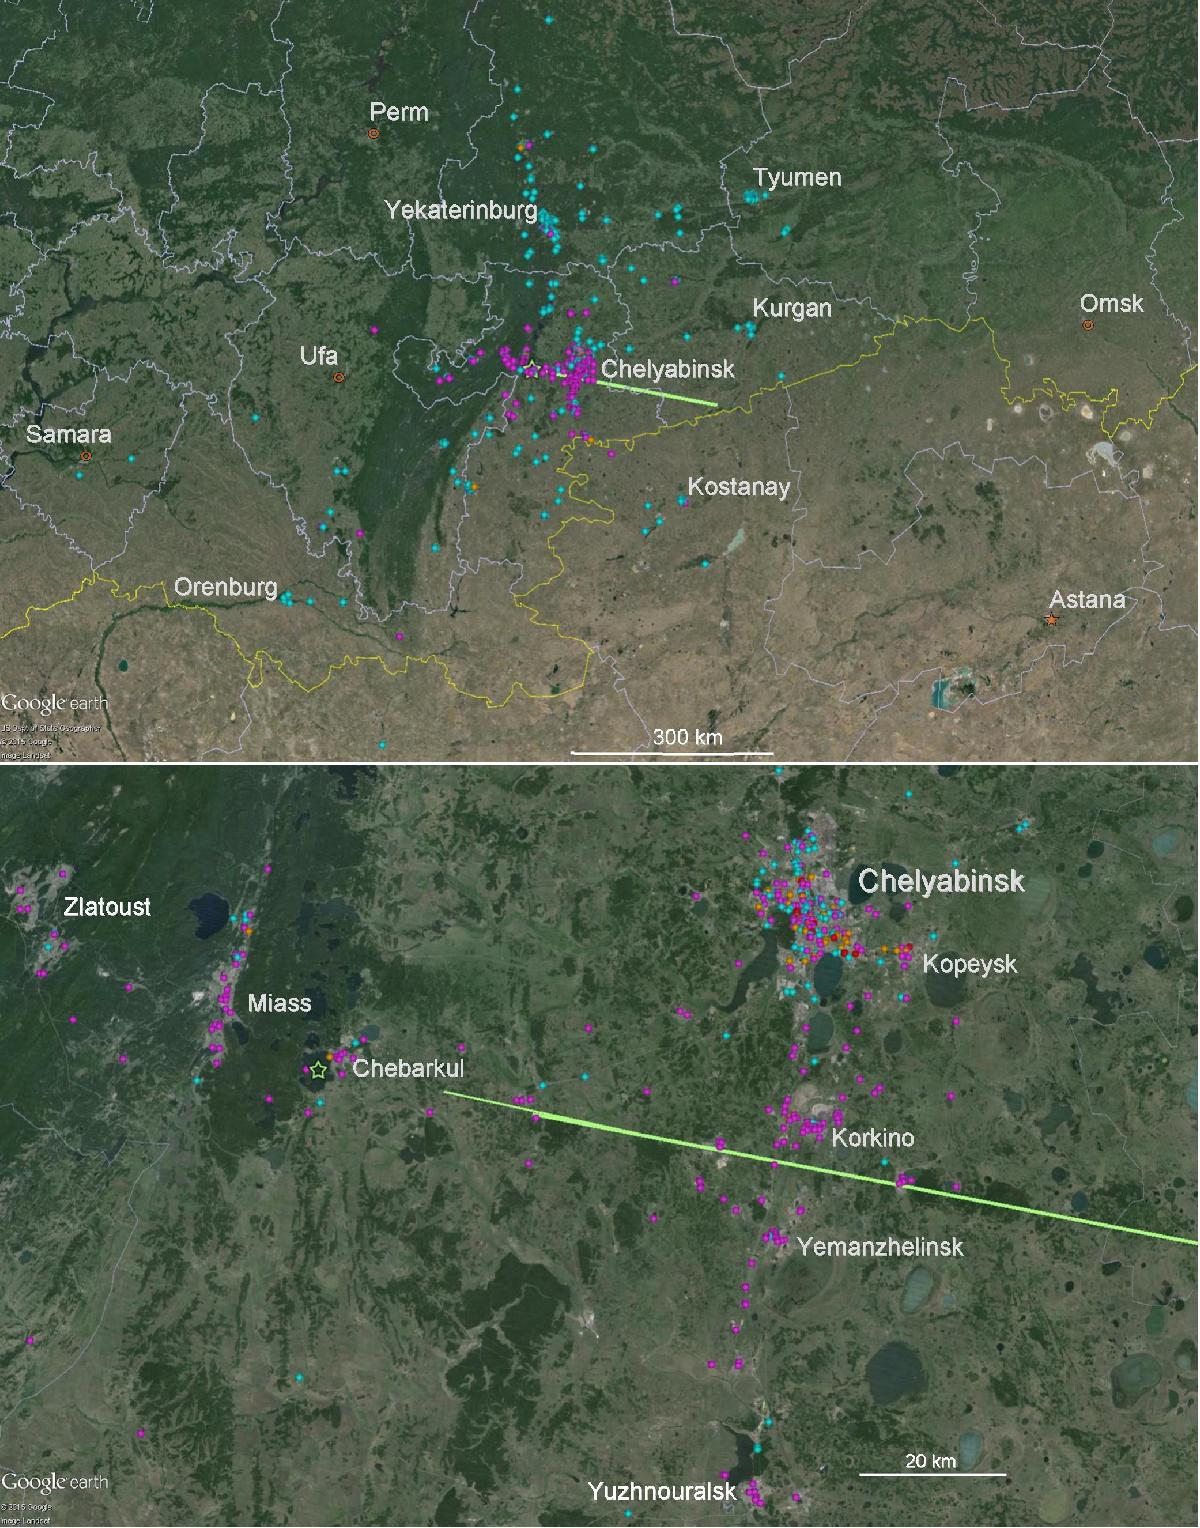
Map showing the positions of 715 geolocated videos. Upper panel: overview of the whole area where the superbolide was seen; lower panel: region near the end of the bolide, including the city of Chelyabinsk. The green line is the ground projection of the bolide trajectory, including individual fragments (Borovička et al. 2013). The green star is the landing point of the largest fragment (Popova et al. 2013). The cyan dots are locations of videos showing the bolide (Table A.1). Other videos are coded as follows: orange – videos with bolide light (Table A.2), magenta – videos with trail (Table A.3), red – videos showing damage and other consequences (Table A.4). The source of the background map is Google Earth.
Current usage metrics show cumulative count of Article Views (full-text article views including HTML views, PDF and ePub downloads, according to the available data) and Abstracts Views on Vision4Press platform.
Data correspond to usage on the plateform after 2015. The current usage metrics is available 48-96 hours after online publication and is updated daily on week days.
Initial download of the metrics may take a while.