Fig. 3
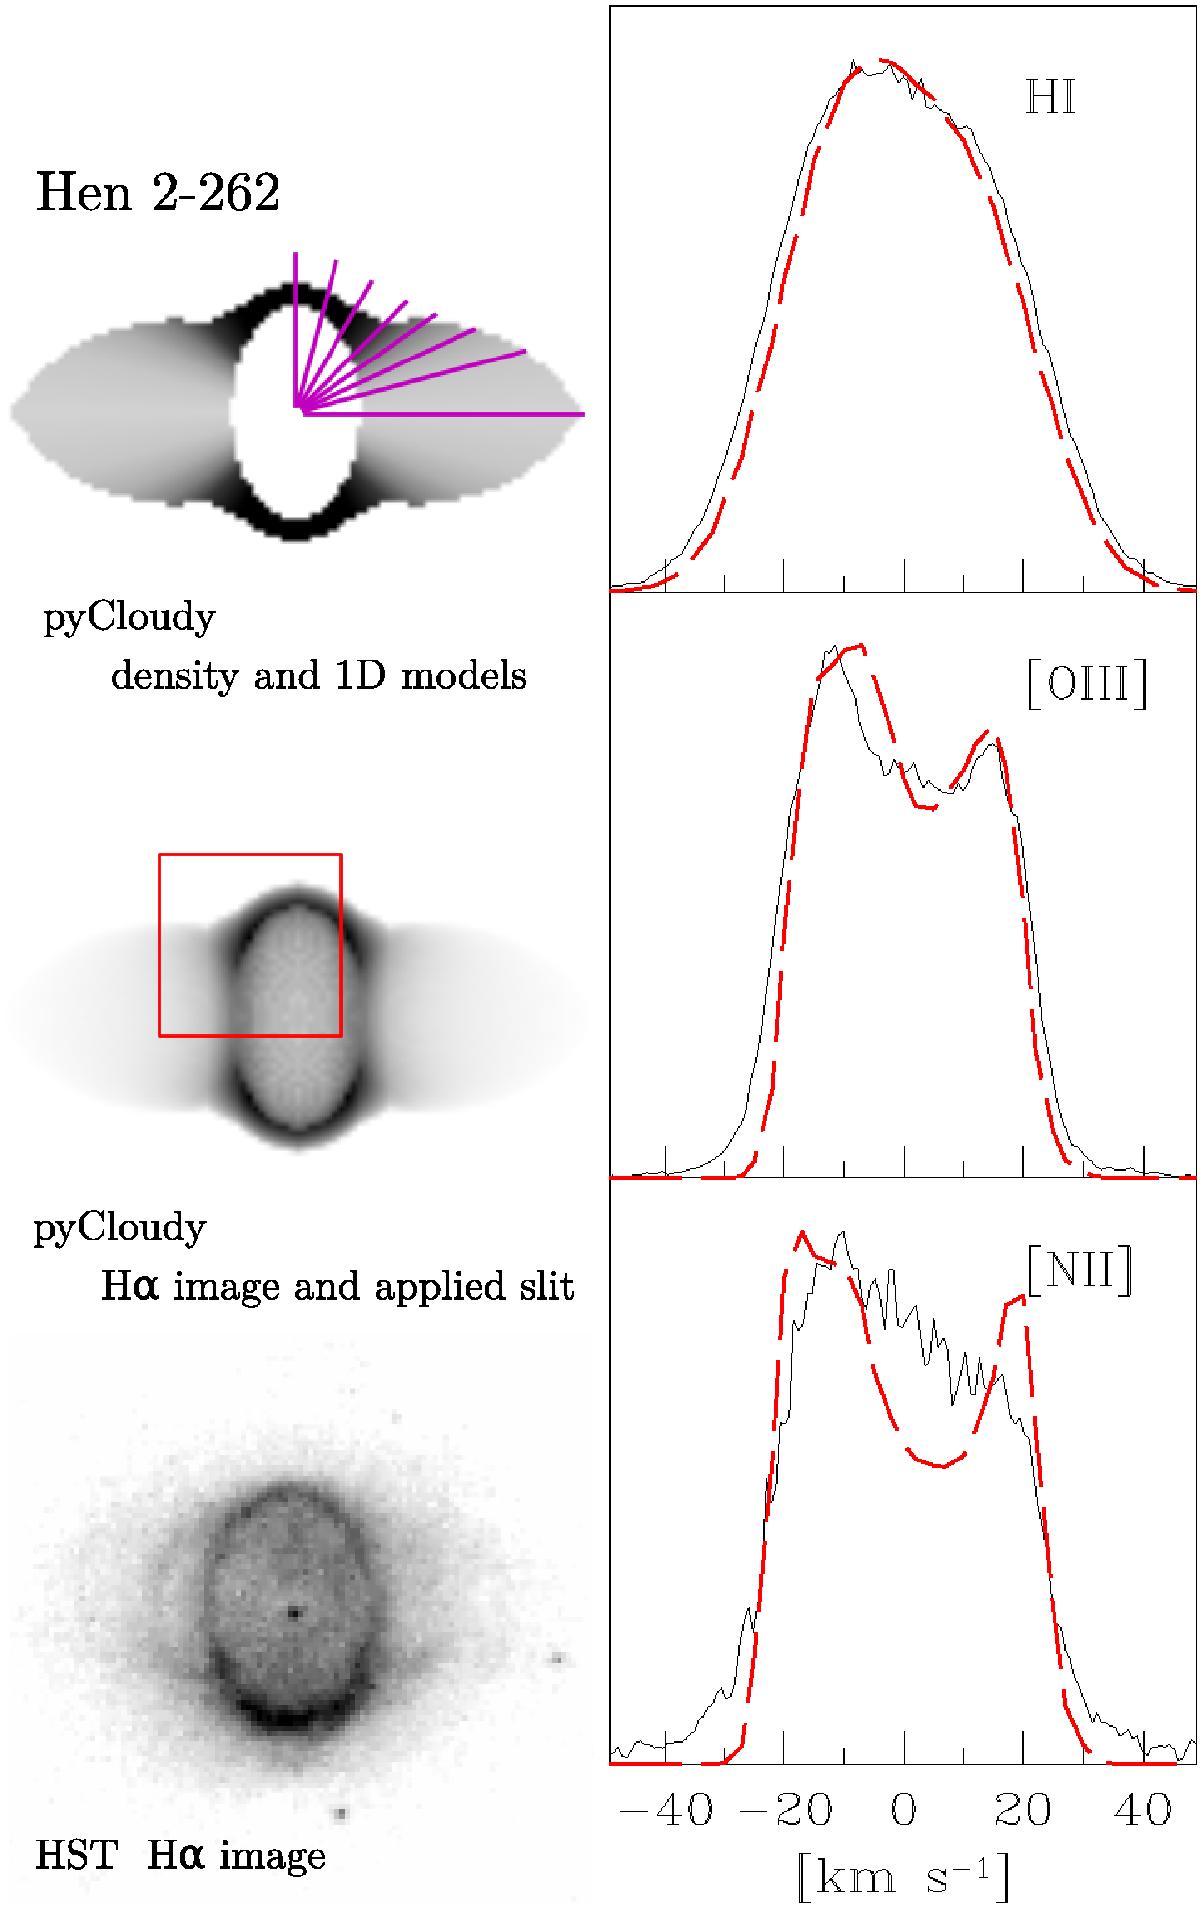
Hen 2-262. The top left panel shows the assumed density structure only for the ionized nebula, drawn at the cross-section plane taken along the positioned horizontal symmetry axis. The magenta lines indicate the directions along which the 1D constant density Cloudy models were calculated. The end of each line segment corresponds to the assumed matter (density) boundary. The middle left panel shows the Hα image (i.e. a projection onto a plane of the 3D structure) obtained for the same model, but inclined to the sky plane at 20° to correspond approximately to the HST image shown in the bottom left panel (also in Fig. 1). The intensity grey scale is linear in all three images, the size is scaled to fill the width of the box. The red rectangle in the middle panel indicates the area over which the line profiles are integrated. The nebular emission line profiles are shown on the right; the solid black lines show the observations and the dashed red lines show the computed model for Hα, [O iii] 5007 Å, and [N ii] 6583 Å.
Current usage metrics show cumulative count of Article Views (full-text article views including HTML views, PDF and ePub downloads, according to the available data) and Abstracts Views on Vision4Press platform.
Data correspond to usage on the plateform after 2015. The current usage metrics is available 48-96 hours after online publication and is updated daily on week days.
Initial download of the metrics may take a while.