Fig. 11
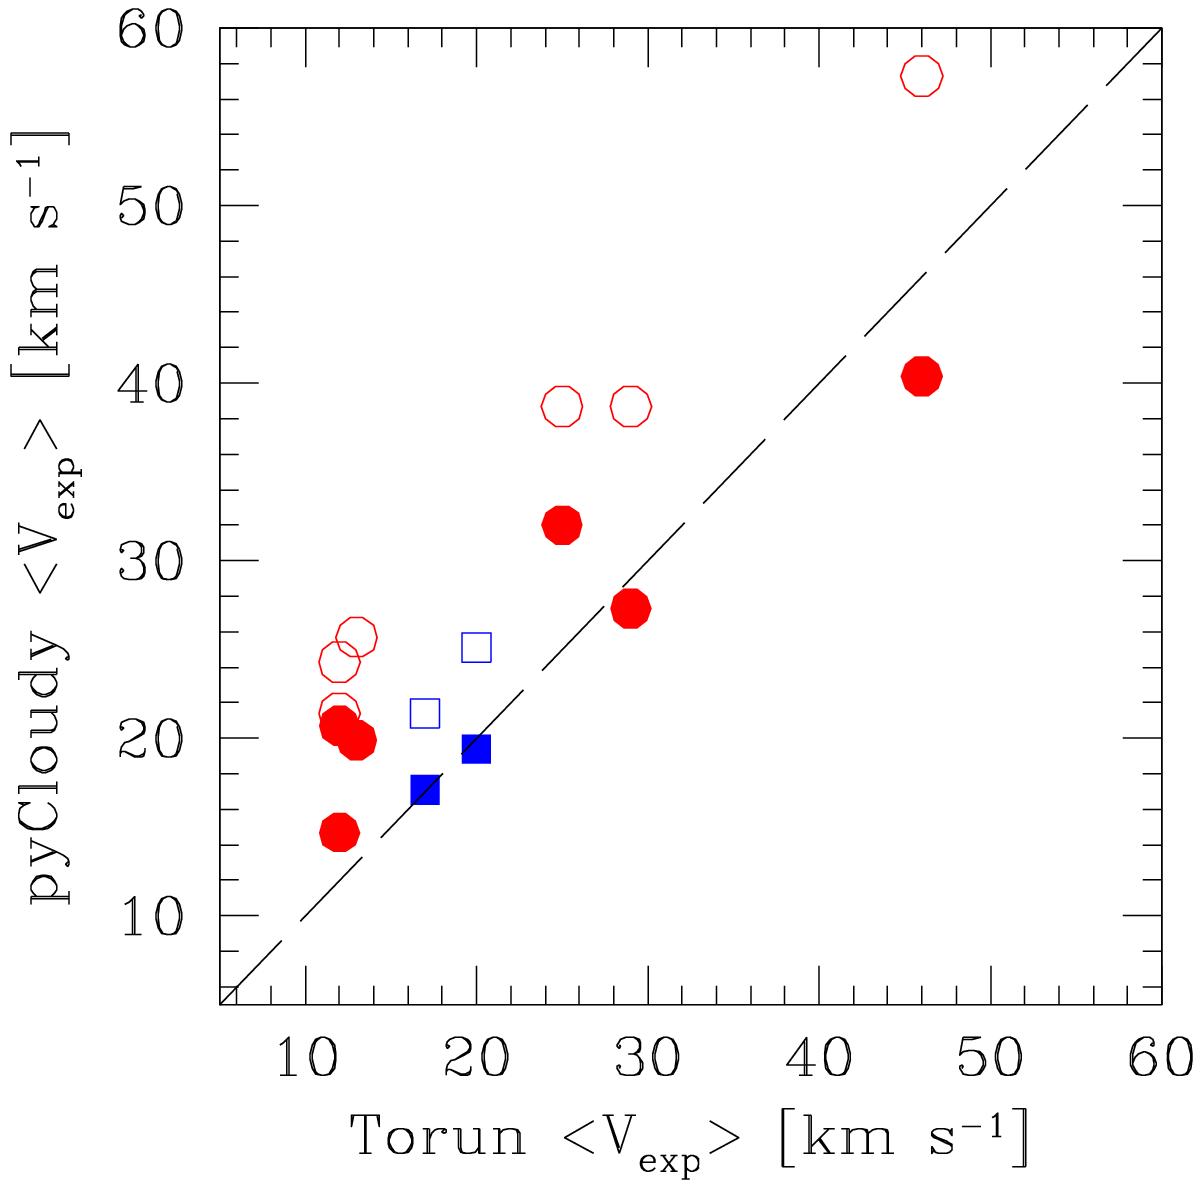
Averaged expansion velocity from Torun models compared with pyCloudy. The abscissa shows the Torun models mass-averaged velocities, while at ordinate the pyCloudy Hβ-averaged values are shown as filled symbols, and the pyCloudy mass-averaged as open symbols. The (red) circles show the bipolar nebulae and the (blue) squares the post-bipolars. Data from Table A.1.
Current usage metrics show cumulative count of Article Views (full-text article views including HTML views, PDF and ePub downloads, according to the available data) and Abstracts Views on Vision4Press platform.
Data correspond to usage on the plateform after 2015. The current usage metrics is available 48-96 hours after online publication and is updated daily on week days.
Initial download of the metrics may take a while.