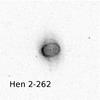
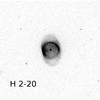
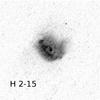
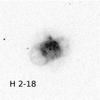
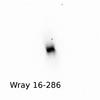
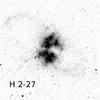
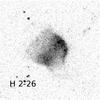
Fig. 1
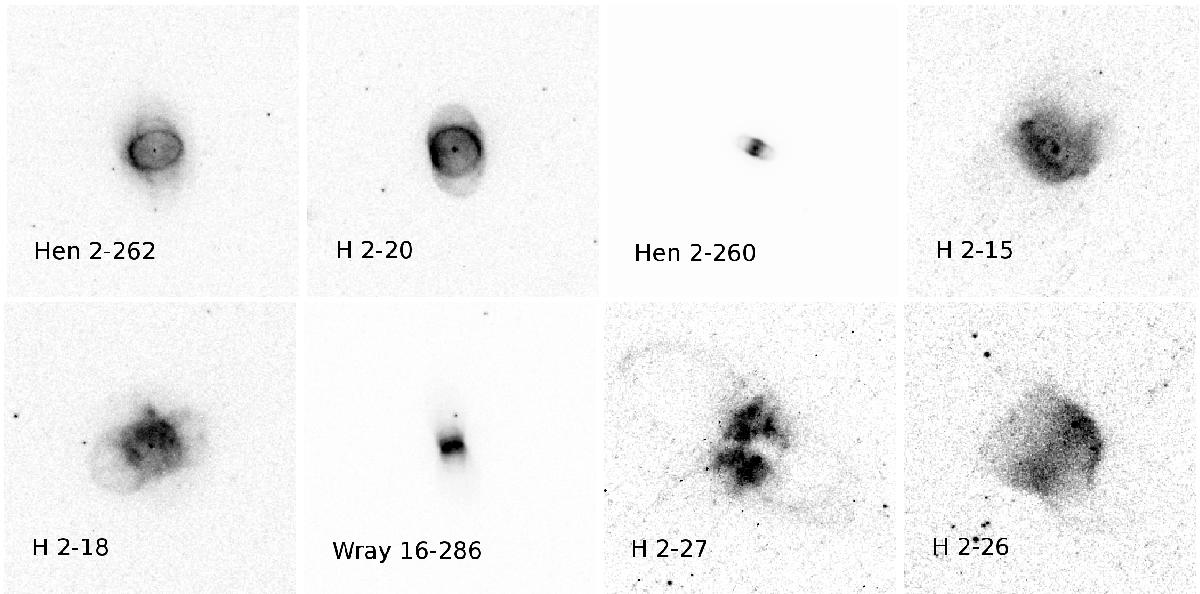
Hα HST images presented at the same angular scale. Each panel is 12 arcsec per side. The intensity scale is linear. The names are indicated in each panel. The first three columns show PNe in the bipolar phase while the rightmost column shows the proposed post-bipolar phase (see text). Six PNe are assumed to belong to the Galactic bulge while the smallest and largest, both shown in the third column, are assumed to be located behind and in front of the bulge, respectively.
Current usage metrics show cumulative count of Article Views (full-text article views including HTML views, PDF and ePub downloads, according to the available data) and Abstracts Views on Vision4Press platform.
Data correspond to usage on the plateform after 2015. The current usage metrics is available 48-96 hours after online publication and is updated daily on week days.
Initial download of the metrics may take a while.