Free Access
Fig. 9
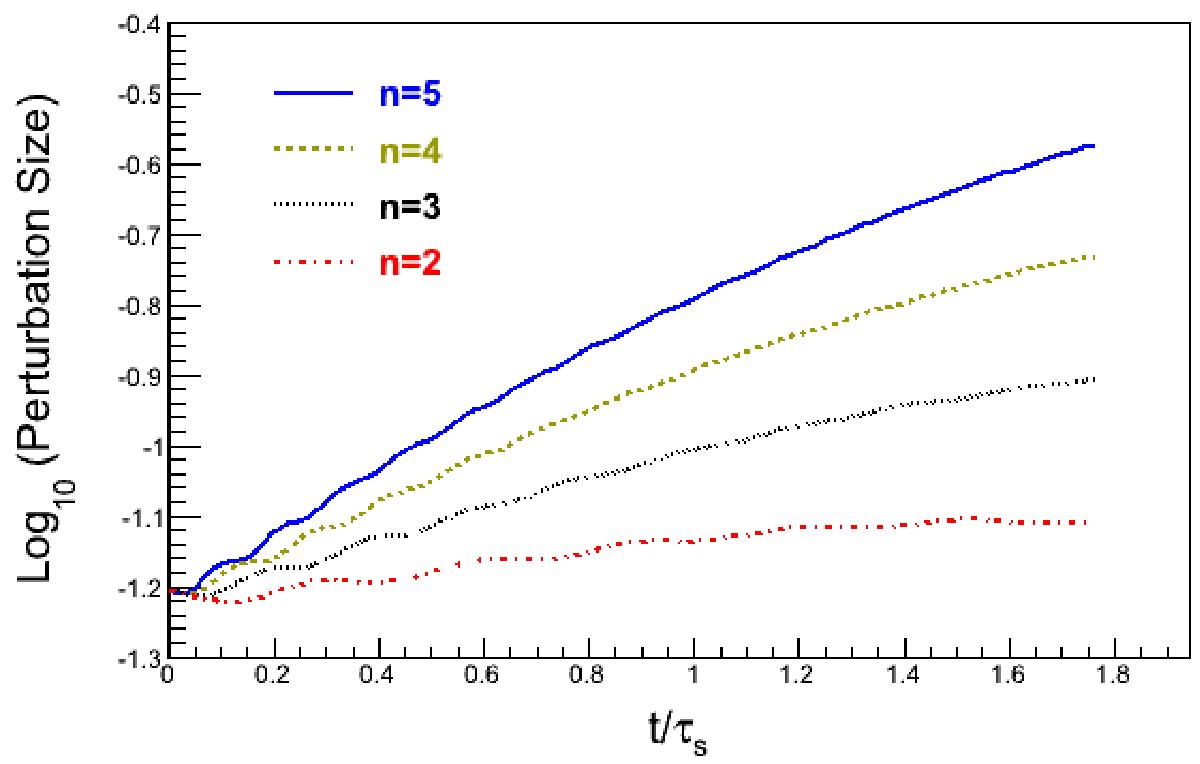
Growth rate of the n = 2–5 modes for the shear instability when the shearing boundary is in the radial direction, for the first 1.8 sound crossing times. The n = 5 mode is the solid blue line, the n = 4 mode is the dashed gold line, the n = 3 mode is the dotted black line, and the n = 2 mode is the dashed-dotted red line.
Current usage metrics show cumulative count of Article Views (full-text article views including HTML views, PDF and ePub downloads, according to the available data) and Abstracts Views on Vision4Press platform.
Data correspond to usage on the plateform after 2015. The current usage metrics is available 48-96 hours after online publication and is updated daily on week days.
Initial download of the metrics may take a while.