Free Access
Fig. 2
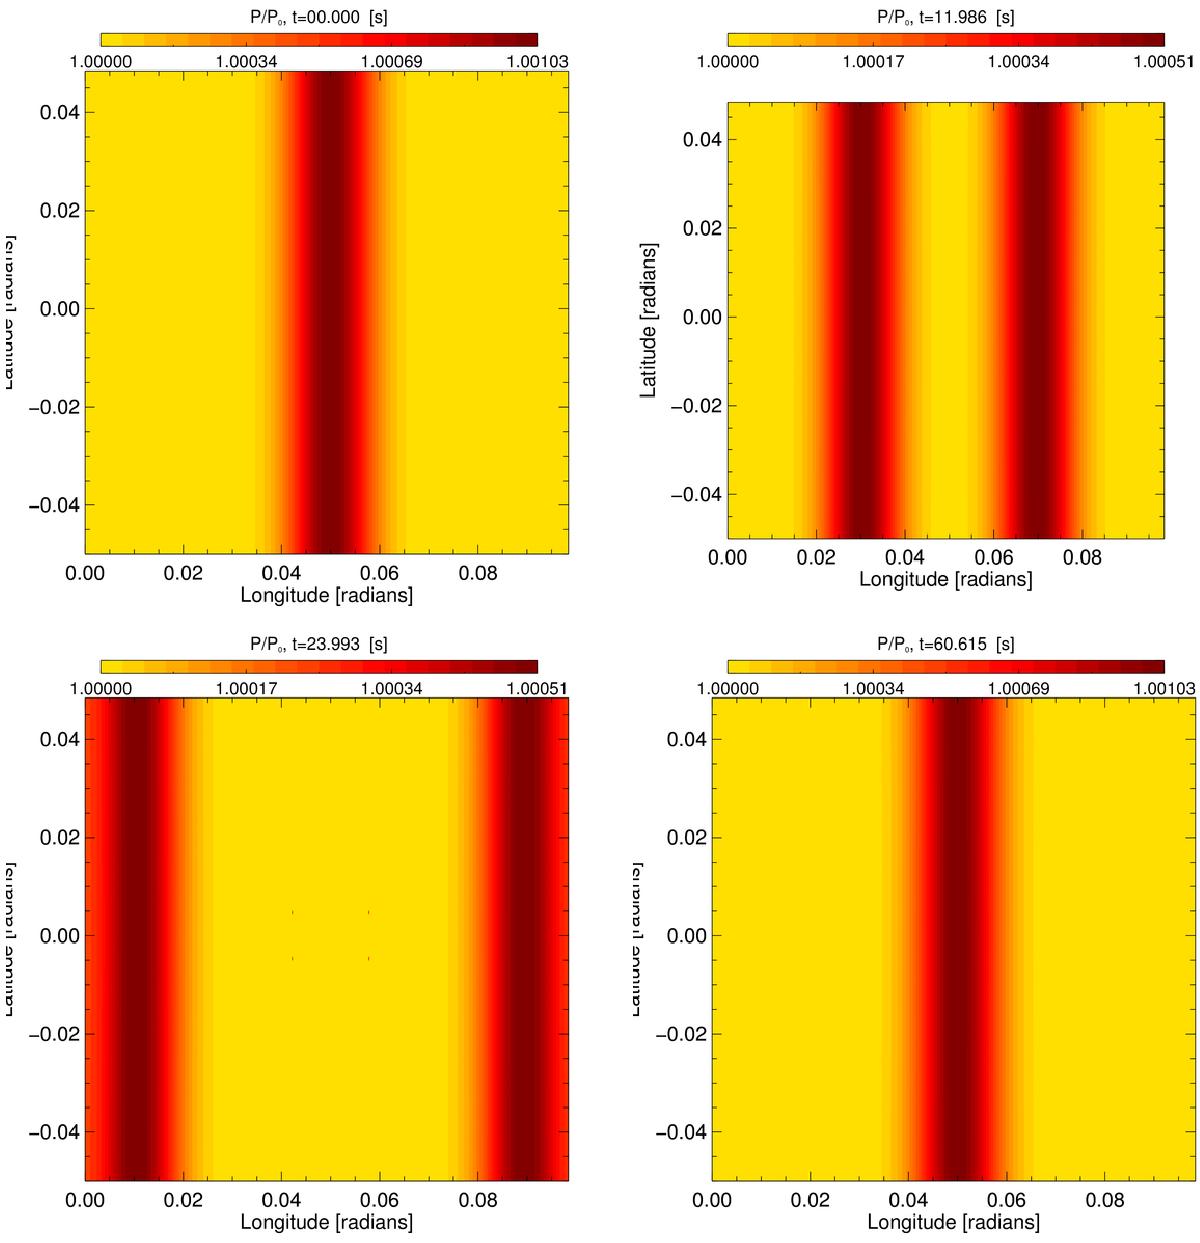
Contour plot of the pressure in the plane wave test at the center of the radial range. The pressure perturbation moves towards the edges, preserving shape, like a 1D. After one period, the wave is back to its initial position. This behavior is constant in radius.
Current usage metrics show cumulative count of Article Views (full-text article views including HTML views, PDF and ePub downloads, according to the available data) and Abstracts Views on Vision4Press platform.
Data correspond to usage on the plateform after 2015. The current usage metrics is available 48-96 hours after online publication and is updated daily on week days.
Initial download of the metrics may take a while.