Free Access
Fig. 6
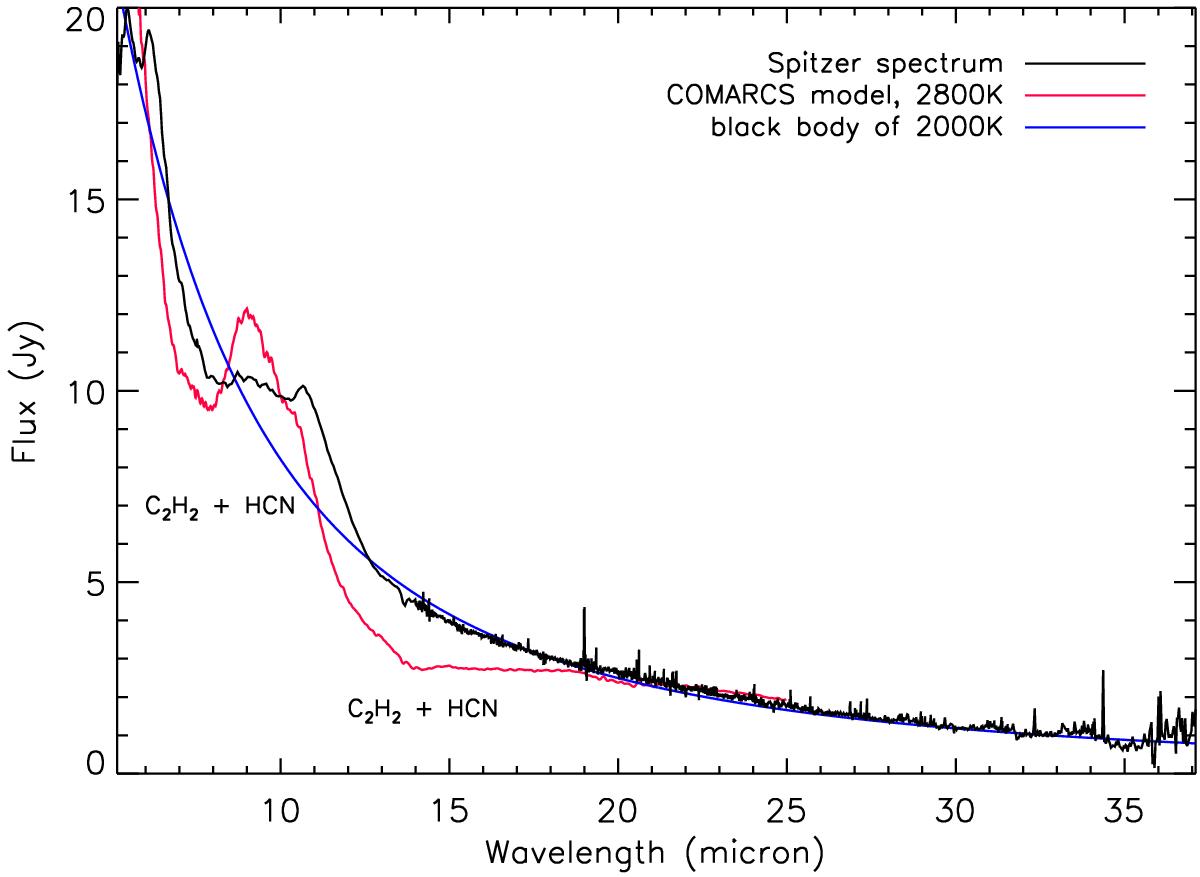
Spitzer IRS spectrum of LX Cyg (black line). Over-plotted in blue is the same black-body spectrum as in Fig. 5, as well as a scaled dust-free C-star model spectrum from Aringer et al. (2009, red line).
Current usage metrics show cumulative count of Article Views (full-text article views including HTML views, PDF and ePub downloads, according to the available data) and Abstracts Views on Vision4Press platform.
Data correspond to usage on the plateform after 2015. The current usage metrics is available 48-96 hours after online publication and is updated daily on week days.
Initial download of the metrics may take a while.