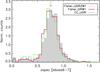
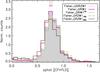
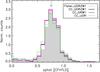
Fig. 9

Redshift distributions for the five Fisher and the CC_UGRI selections. The median redshift value is indicated by an arrow on the top x-axis. Top panel: eboss6-7 zspec. Middle panel: CFHTLS zphot for the Fisher selections. Bottom panel: CFHTLS zphot for the colour–colour selections. We report the Fisher_UGRIZW1 selection to facilitate the comparison.
Current usage metrics show cumulative count of Article Views (full-text article views including HTML views, PDF and ePub downloads, according to the available data) and Abstracts Views on Vision4Press platform.
Data correspond to usage on the plateform after 2015. The current usage metrics is available 48-96 hours after online publication and is updated daily on week days.
Initial download of the metrics may take a while.