Fig. 8
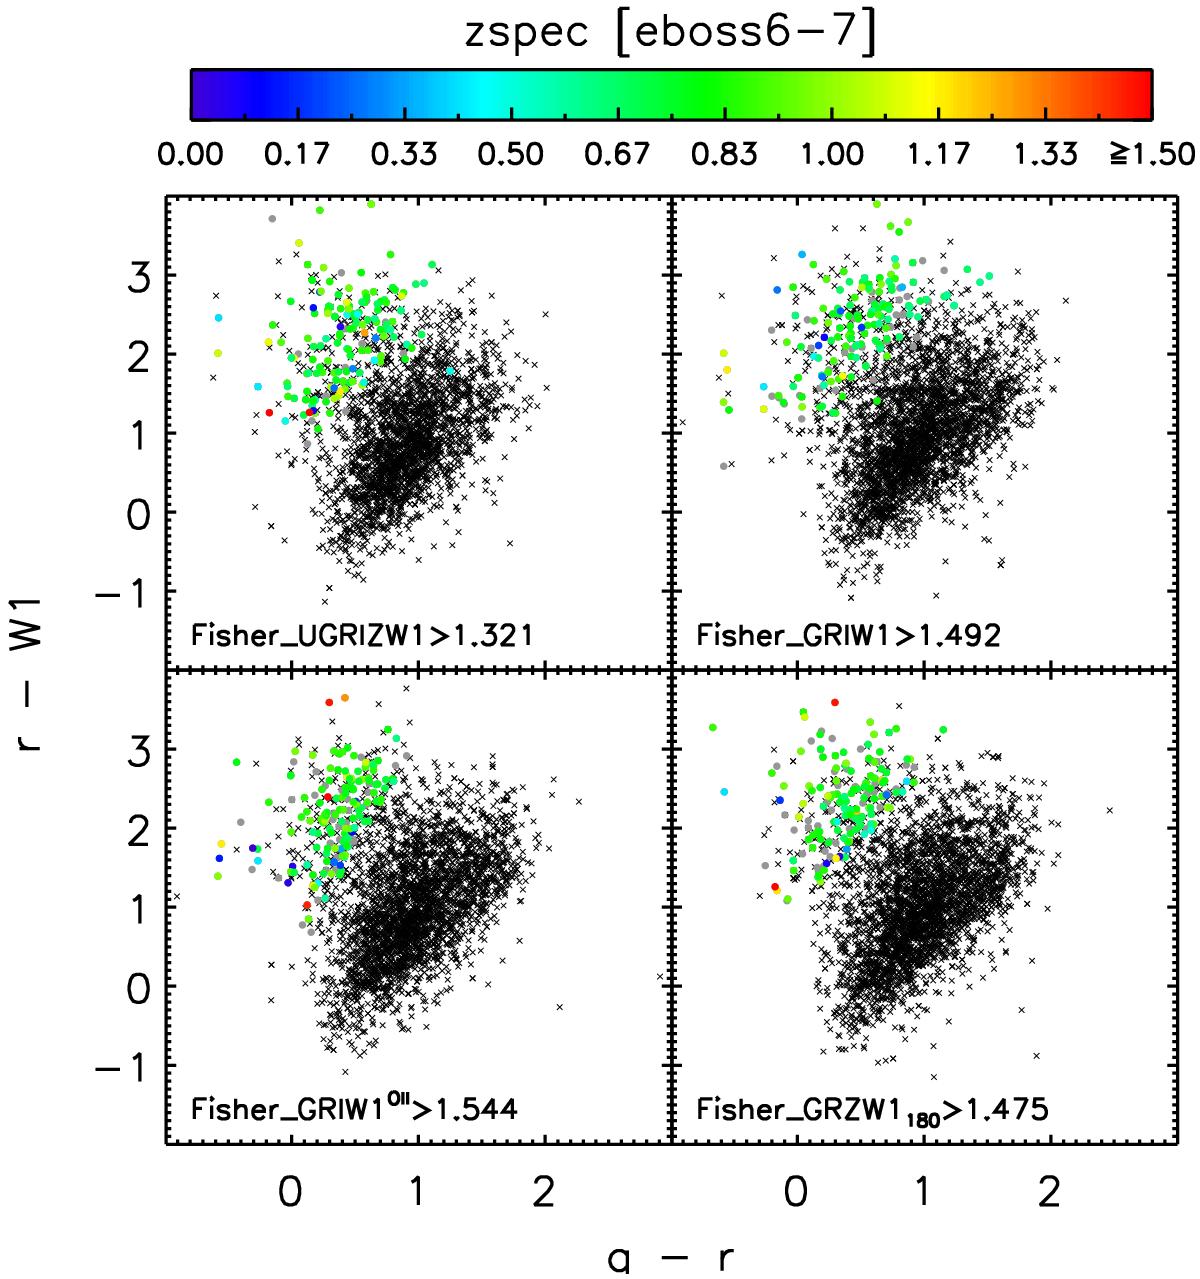
r−W1 vs. g−r colour–colour plot of the four defined Fisher discriminants. For each selection, crosses represent photometric objects in the eboss6-7 area passing all the cuts in Table 2, except the cut on the Fisher discriminant. Filled dots represent those passing the cut on the Fisher disriminant with the colour coding zspec when observed with the eboss6-7 test plates (grey colour when no reliable zspec could be estimated from the spectrum or if the object has not been observed). For clarity, we display only one out of ten objects.
Current usage metrics show cumulative count of Article Views (full-text article views including HTML views, PDF and ePub downloads, according to the available data) and Abstracts Views on Vision4Press platform.
Data correspond to usage on the plateform after 2015. The current usage metrics is available 48-96 hours after online publication and is updated daily on week days.
Initial download of the metrics may take a while.