Fig. 3
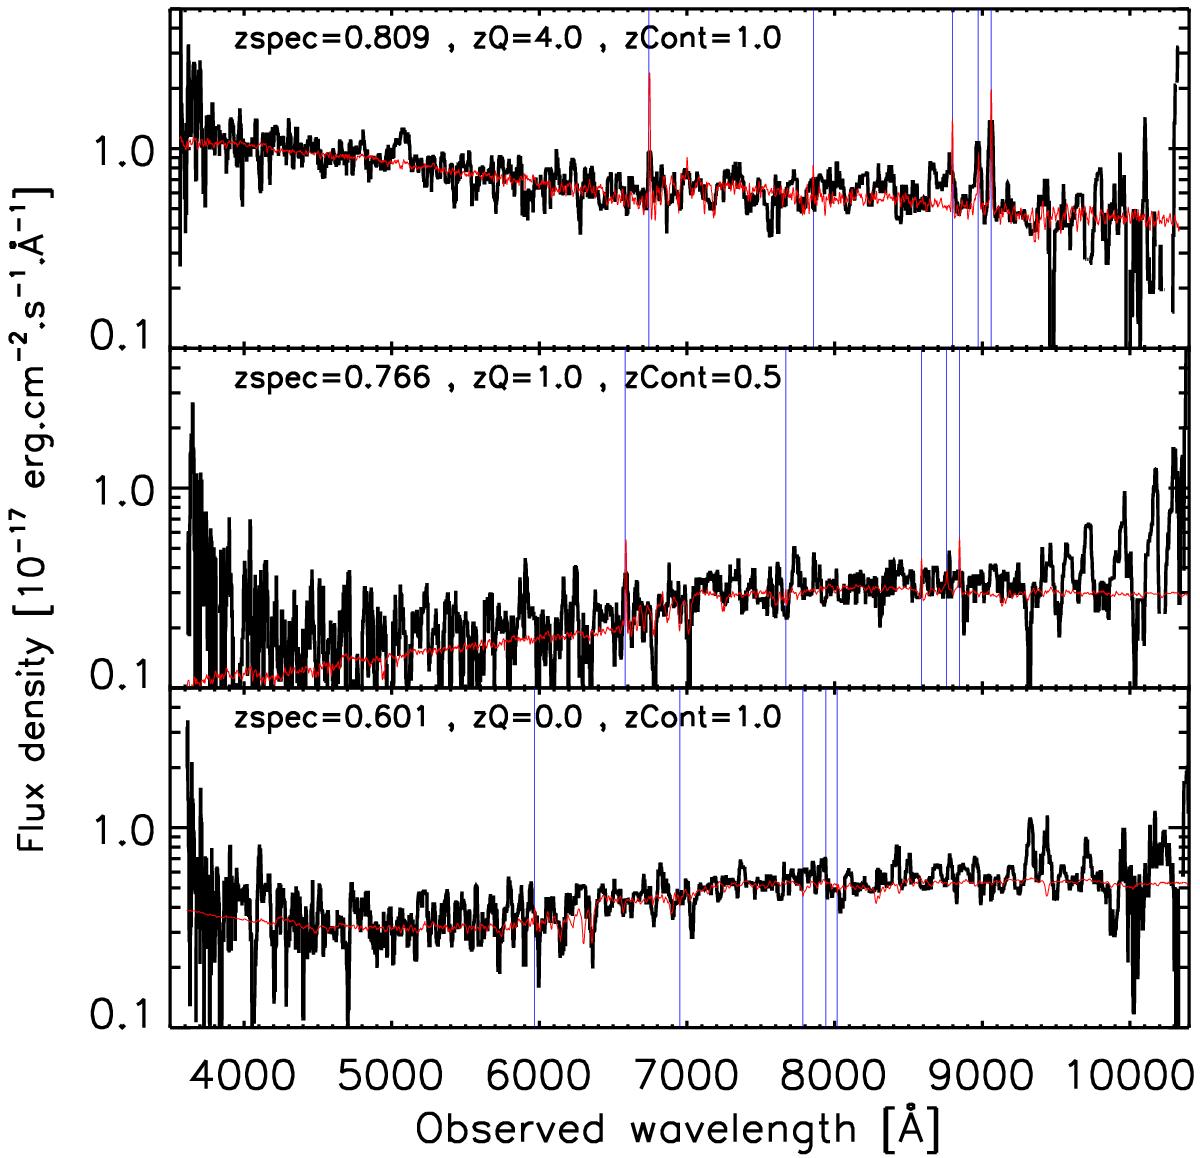
Example of three eboss6-7 spectra, illustrating the confidence flags (zQ, zCont). The observed spectra (black) is smoothed: each pixel is replaced by the median value of the 20 nearest pixels. The best-fit model is in red. Vertical blue lines illustrate the location of some expected emission lines in the observed frame: [Oii]3725−3727, Hγ4342, Hβ4862, [Oiii]4959, [Oiii]5007 (in increasing wavelength).
Current usage metrics show cumulative count of Article Views (full-text article views including HTML views, PDF and ePub downloads, according to the available data) and Abstracts Views on Vision4Press platform.
Data correspond to usage on the plateform after 2015. The current usage metrics is available 48-96 hours after online publication and is updated daily on week days.
Initial download of the metrics may take a while.