Fig. 13
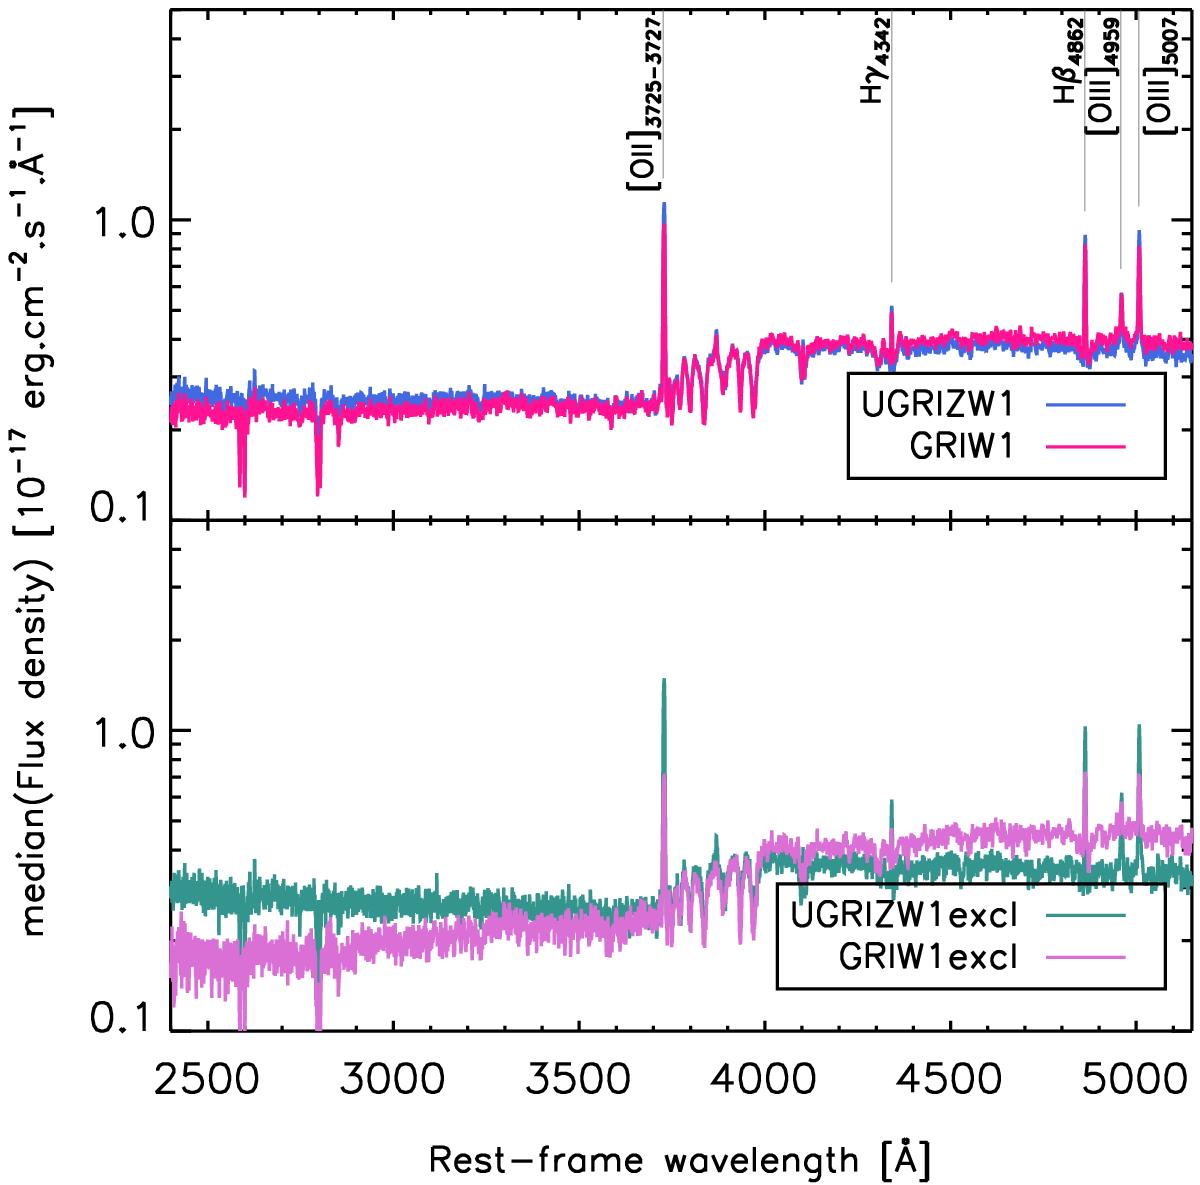
Stacked spectra from the eboss6-7 plates galaxies with 0.6 ≤ zspec ≤ 1.0 passing the Fisher_UGRIZW1 and Fisher_GRIW1 selections. Top panel: the stacking (average S/N of ~5) is done using all galaxies passing the selections (~1100 galaxies per stack). Bottom panel: the stacking (average S/N of ~3) is done using only galaxies not belonging to the intersection between Fisher_UGRIZW1 and Fisher_GRIW1 selections (~300 galaxies per stack), to enhance the differences.
Current usage metrics show cumulative count of Article Views (full-text article views including HTML views, PDF and ePub downloads, according to the available data) and Abstracts Views on Vision4Press platform.
Data correspond to usage on the plateform after 2015. The current usage metrics is available 48-96 hours after online publication and is updated daily on week days.
Initial download of the metrics may take a while.