Fig. 12
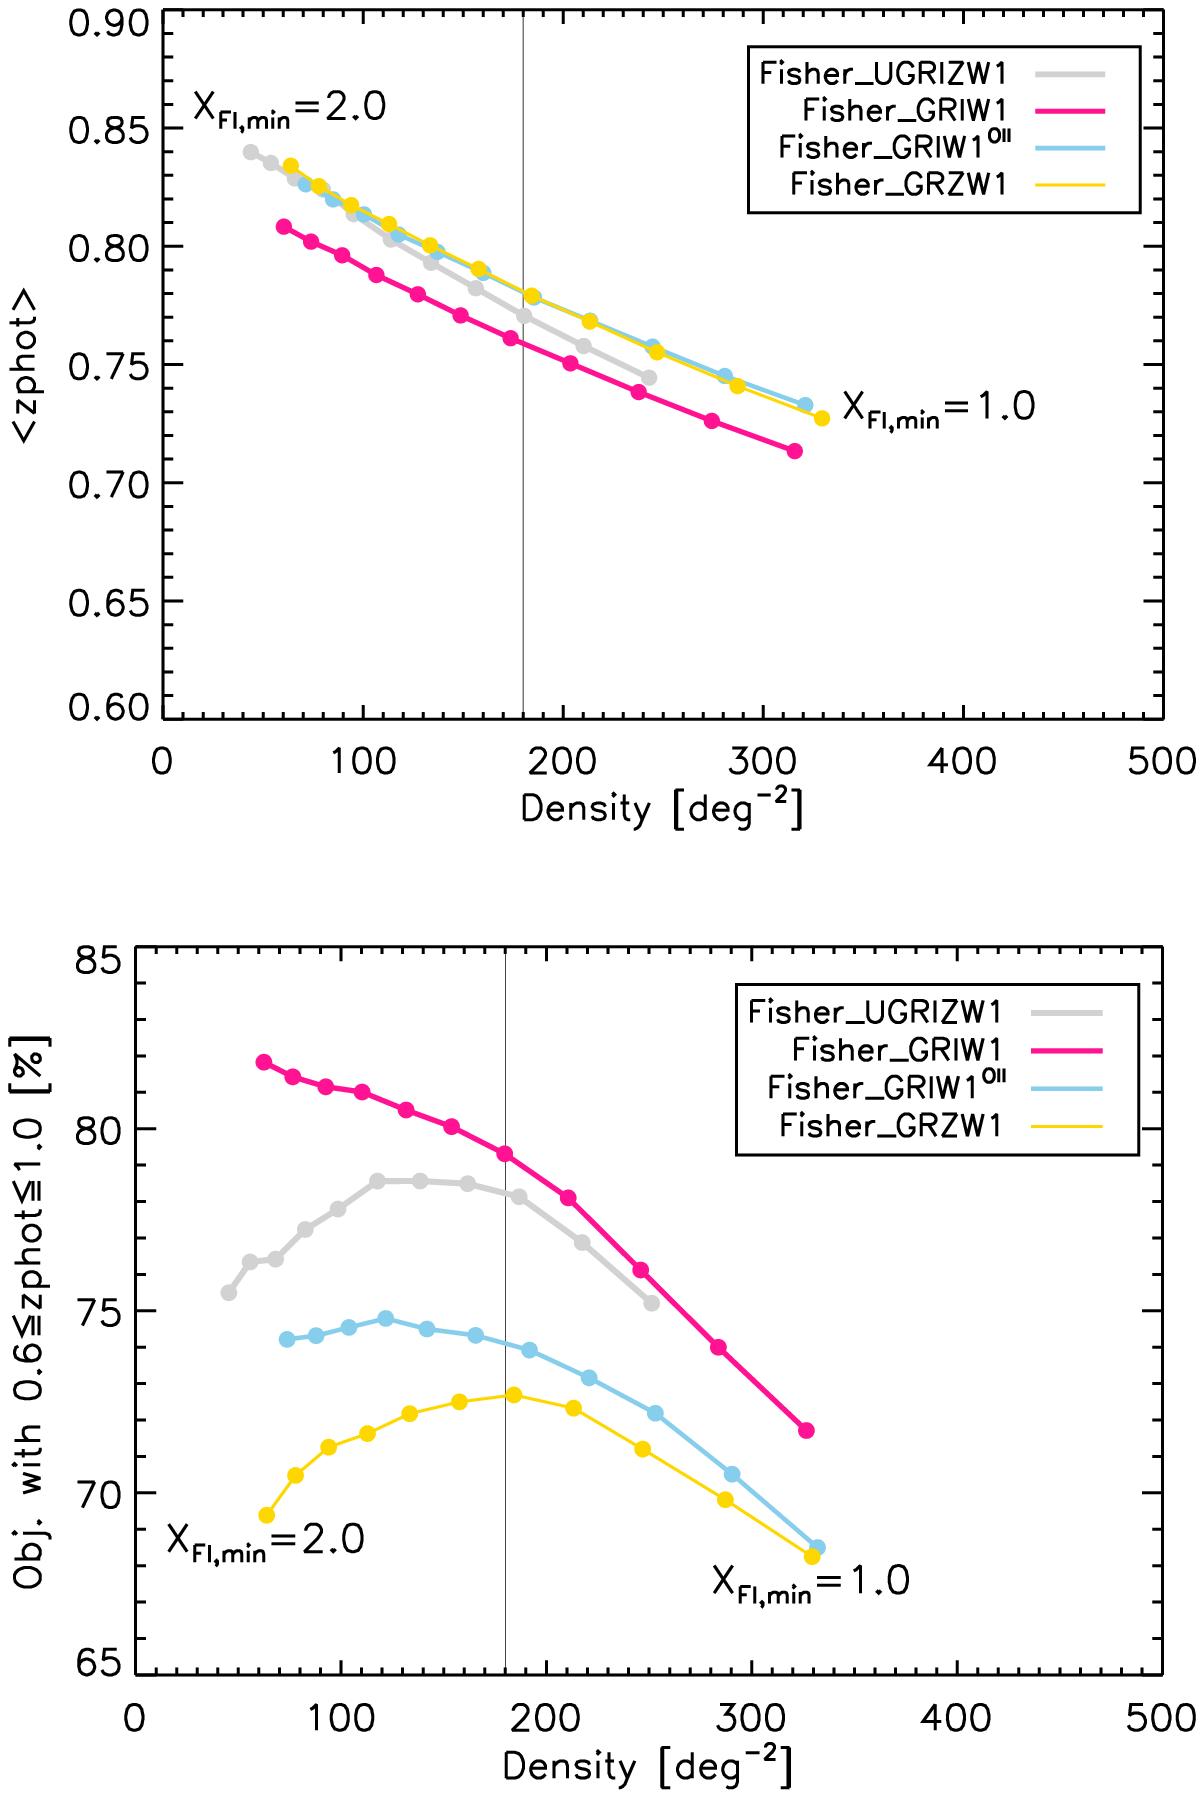
Selection dependence on XFI,min, the Fisher discriminant threshold cut. XFI,min varies from 2.0 (low densities, left) to 1.0 (high densities, right) with a step of 0.1. The sky region considered here is our ~50 deg2 test area within the CFHTLS W1 field. Top panel: mean zphot of the selection. Bottom panel: percentage of galaxies with 0.6 ≤ zphot ≤ 1.0 estimated with the CFHTLS zphot. The thin vertical line illustrates the 180 deg-2 density used to set the Fisher discriminant threshold cut in Sect. 5.4.
Current usage metrics show cumulative count of Article Views (full-text article views including HTML views, PDF and ePub downloads, according to the available data) and Abstracts Views on Vision4Press platform.
Data correspond to usage on the plateform after 2015. The current usage metrics is available 48-96 hours after online publication and is updated daily on week days.
Initial download of the metrics may take a while.