Fig. 1
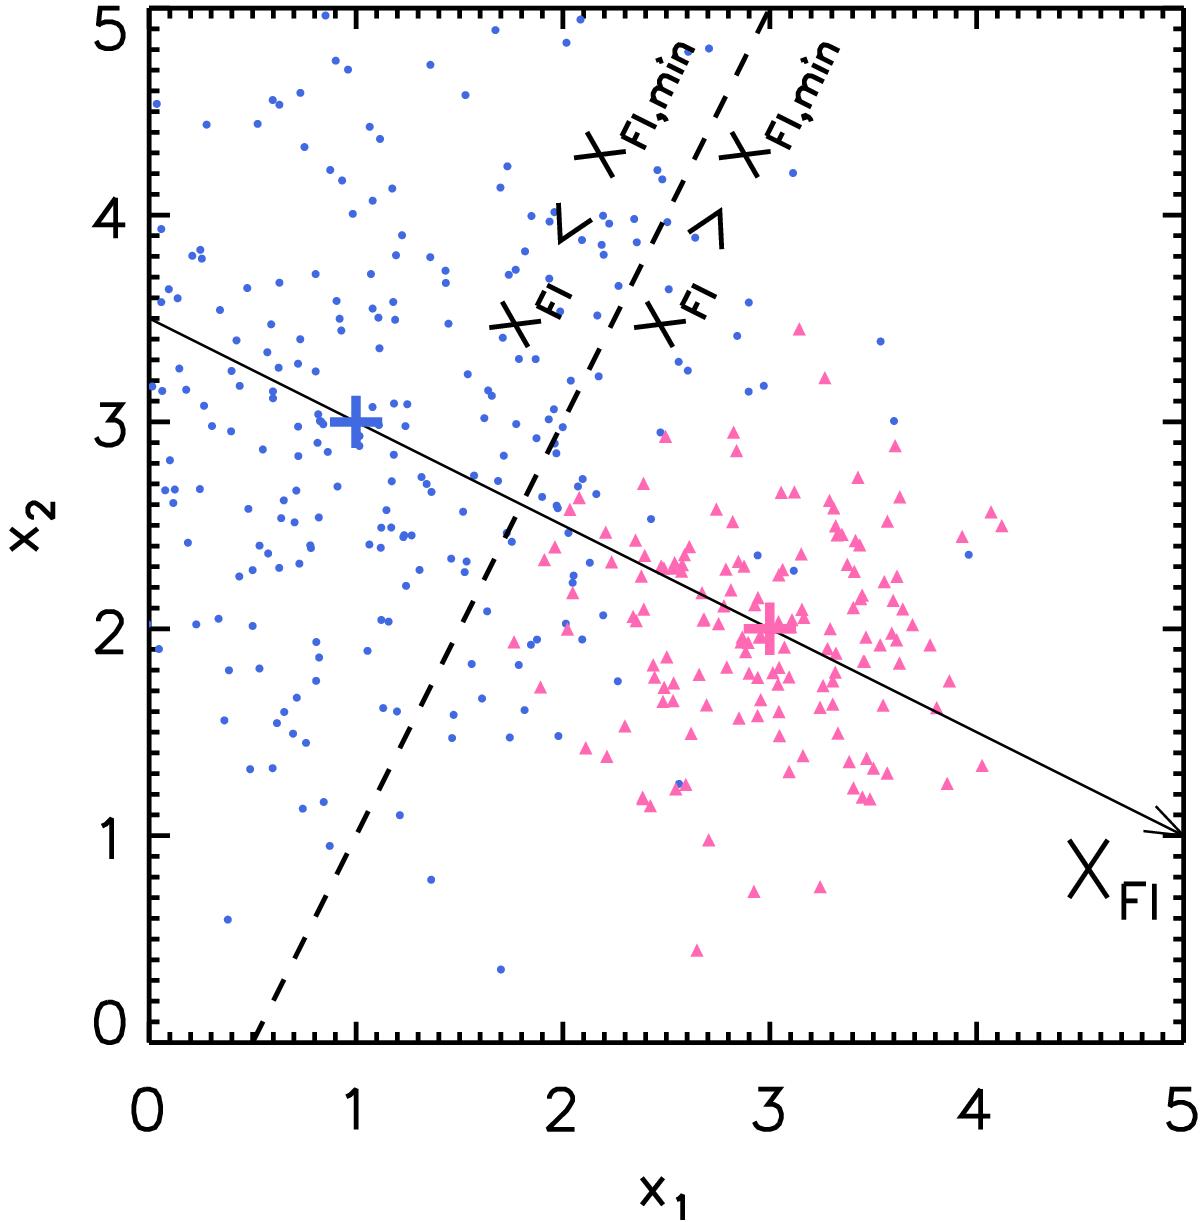
Illustration of the Fisher discriminant method with N = 2. The (y1) class is in blue dots, with the blue cross at ![]() , while the (y2) class is in pink triangles, with the pink cross at
, while the (y2) class is in pink triangles, with the pink cross at ![]() . For each event, the Fisher discriminant XFI corresponds to its orthogonal projection along the axis defined by
. For each event, the Fisher discriminant XFI corresponds to its orthogonal projection along the axis defined by ![]() and
and ![]() . The dashed line illustrates the hyperplane used to split the events in two classes.
. The dashed line illustrates the hyperplane used to split the events in two classes.
Current usage metrics show cumulative count of Article Views (full-text article views including HTML views, PDF and ePub downloads, according to the available data) and Abstracts Views on Vision4Press platform.
Data correspond to usage on the plateform after 2015. The current usage metrics is available 48-96 hours after online publication and is updated daily on week days.
Initial download of the metrics may take a while.