Fig. 3
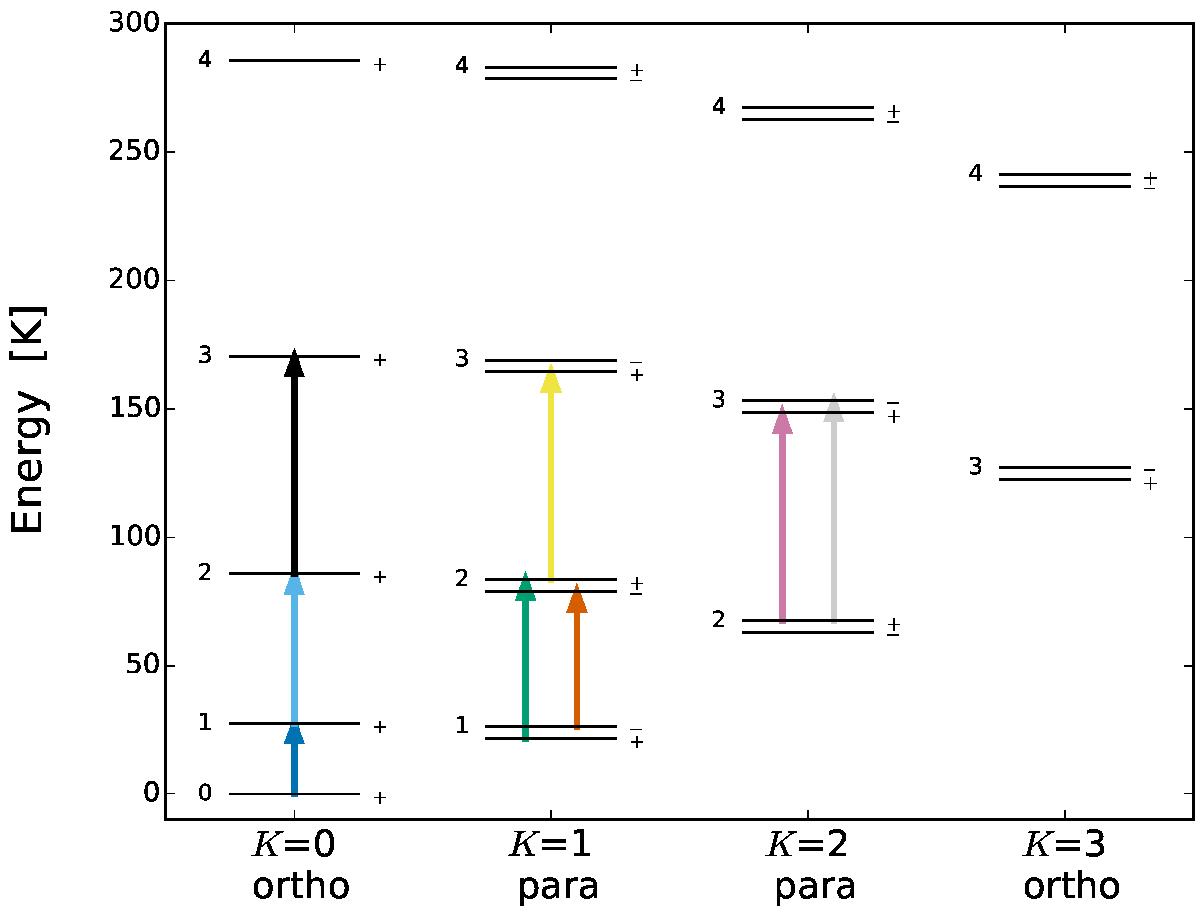
Energy-level diagram of NH3, where the rotational quantum number, J, is placed to the left of each level, the symmetry index, ϵ = + or −, is placed to the right of each level. The symmetry index is that defined by Rist et al. (1993), which might differ from common spectroscopic notation. The transitions are marked with colored arrows, where the direction corresponds to absorption. The gray arrow represents the 1810 GHz transition observed with SOFIA by Wyrowski et al. (2012).
Current usage metrics show cumulative count of Article Views (full-text article views including HTML views, PDF and ePub downloads, according to the available data) and Abstracts Views on Vision4Press platform.
Data correspond to usage on the plateform after 2015. The current usage metrics is available 48-96 hours after online publication and is updated daily on week days.
Initial download of the metrics may take a while.