Fig. 6
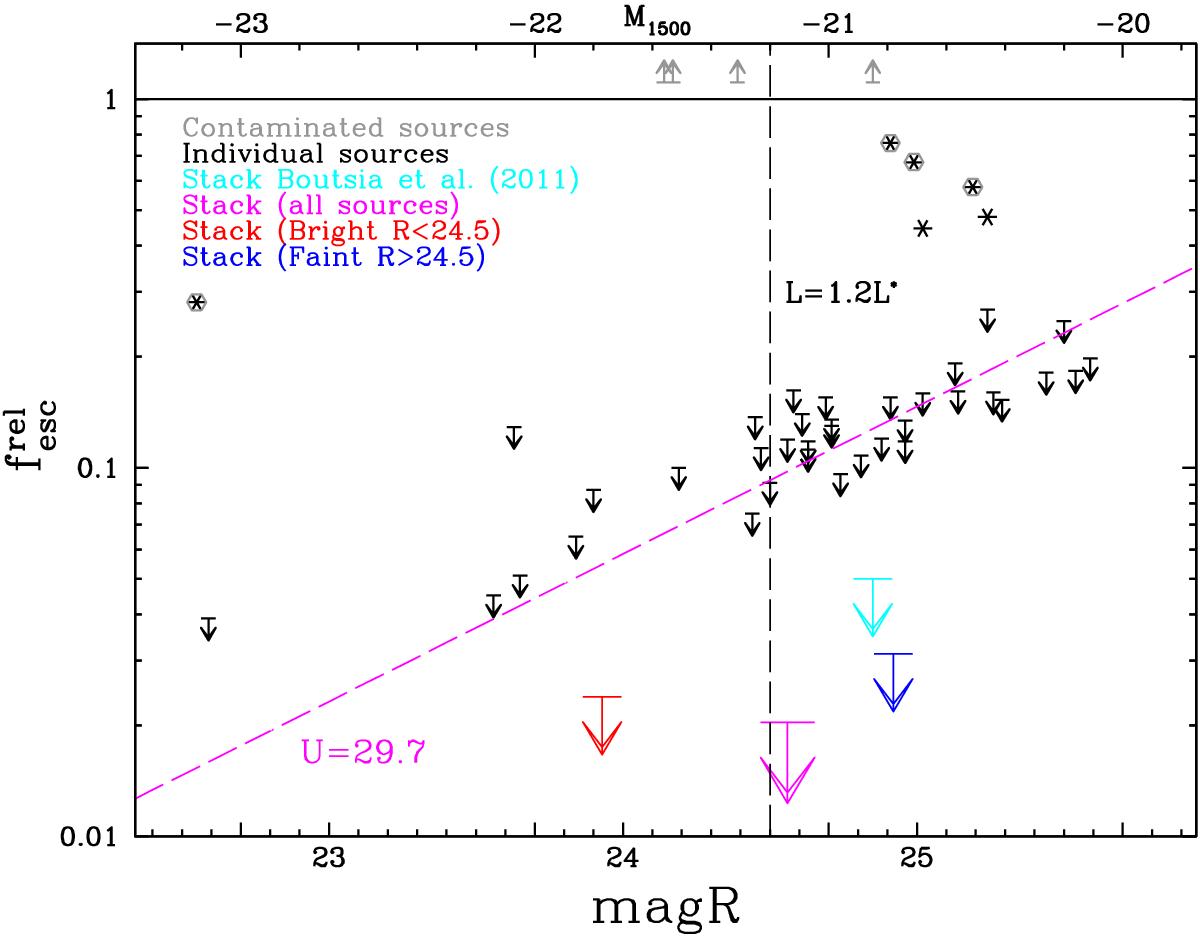
Measured values and upper limits at 1σ for the LyC relative escape fraction of galaxies at z ~ 3.3 in the COSMOS field. Black descending arrows show the upper limits associated with individual galaxies, while the cyan arrow is the limit derived in Boutsia et al. (2011) by stacking 11 galaxies. The red arrow is the limit derived using only relatively bright galaxies with R ≤ 24.5, corresponding roughly to L ≥ 1.2L∗ (M1500 ≤ −21.2). The blue arrow shows the upper limit for fainter galaxies (stack of 26 objects), while the magenta arrow indicates the upper limit for the whole sample (stack of 37 galaxies). The magenta dashed line is the expected ![]() for a limit in the U-band of 29.7 mag (at S/N = 1, assuming an intrinsic ratio L1500/L900 = 3 and a mean IGM transmission of 0.28). This shows that the trend in larger escape fractions with fainter R-band magnitudes is due to the depth of the LBC image in the U-band, and it is probably not due to a physical trend in the population of star-forming galaxies. Asterisks show the galaxies with detection in the U-band and a significant LyC emission. The grey hexagons and the upper arrows indicate likely foreground contamination, where the global or the local escape fractions exceed 100%. Only two sources (ID = 25155 and ID = 63327, black asterisks without the grey hexagons) are examples of possible LyC emitters.
for a limit in the U-band of 29.7 mag (at S/N = 1, assuming an intrinsic ratio L1500/L900 = 3 and a mean IGM transmission of 0.28). This shows that the trend in larger escape fractions with fainter R-band magnitudes is due to the depth of the LBC image in the U-band, and it is probably not due to a physical trend in the population of star-forming galaxies. Asterisks show the galaxies with detection in the U-band and a significant LyC emission. The grey hexagons and the upper arrows indicate likely foreground contamination, where the global or the local escape fractions exceed 100%. Only two sources (ID = 25155 and ID = 63327, black asterisks without the grey hexagons) are examples of possible LyC emitters.
Current usage metrics show cumulative count of Article Views (full-text article views including HTML views, PDF and ePub downloads, according to the available data) and Abstracts Views on Vision4Press platform.
Data correspond to usage on the plateform after 2015. The current usage metrics is available 48-96 hours after online publication and is updated daily on week days.
Initial download of the metrics may take a while.