Fig. 8
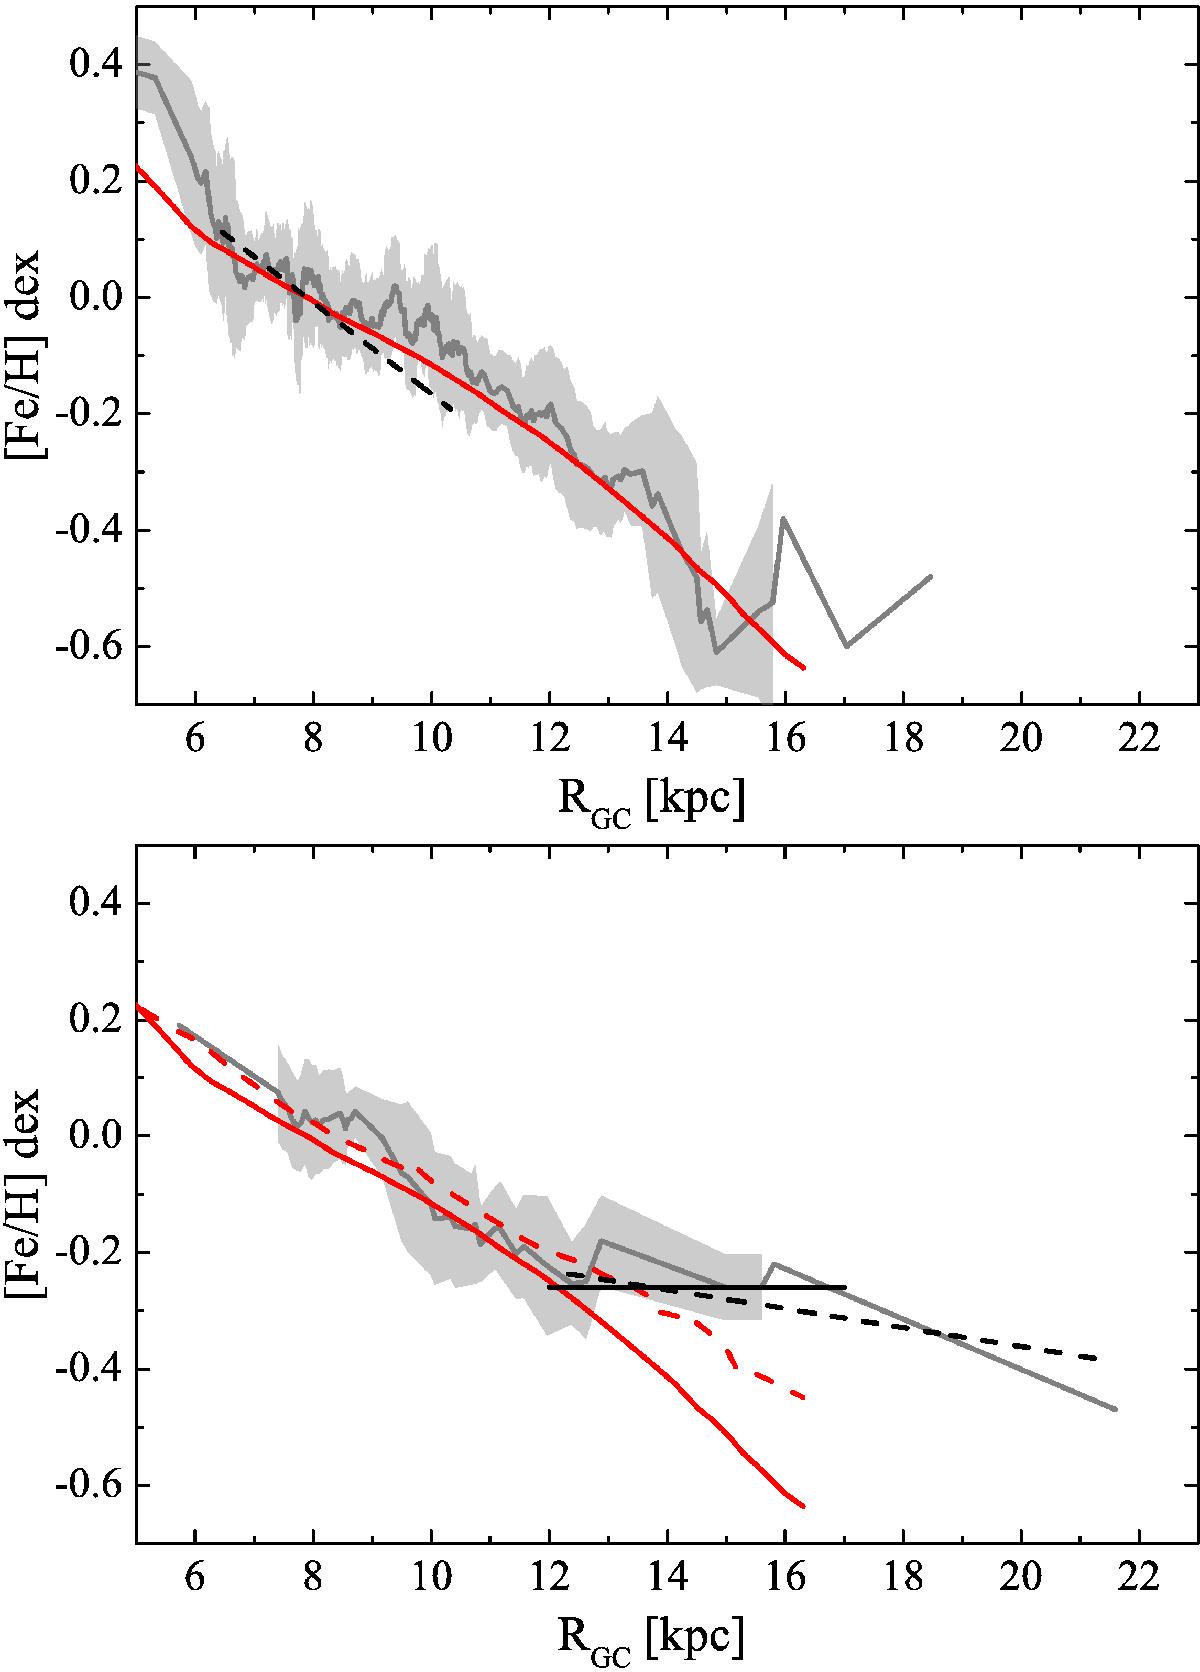
RMD of the open clusters and Cepheids compared to Galactic chemical models. Upper panel: the running average and the spread in iron of the Cepheid sample is shown as a grey line and a light grey area. The red line is the chemical model for the gas by Minchev et al. (2013), the black dashed line shows the gradient derived for the youngest cluster age group (Table 3). Lower panel: in grey we show the running average of intermediate-age clusters (0.5−3 Gyr), the red dashed line is the chemodynamical model by Minchev et al. (2013) for 2 Gyr, the black solid line is the mean value of outer disc clusters, and the black dashed line is the gradient that we derived for all clusters in the outer disc.
Current usage metrics show cumulative count of Article Views (full-text article views including HTML views, PDF and ePub downloads, according to the available data) and Abstracts Views on Vision4Press platform.
Data correspond to usage on the plateform after 2015. The current usage metrics is available 48-96 hours after online publication and is updated daily on week days.
Initial download of the metrics may take a while.