Fig. 4
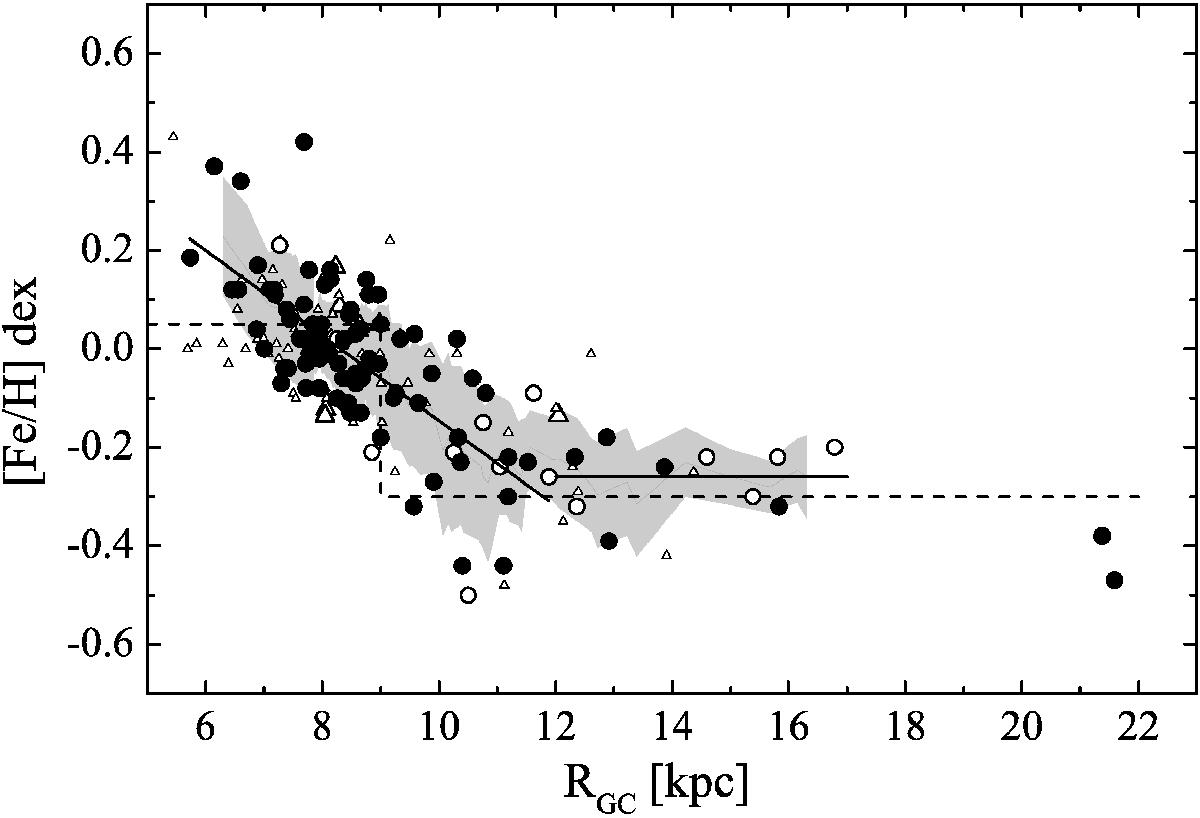
RMD of the open clusters. The circles represent spectroscopic data (HQS in black). Photometric metallicities are shown with triangles, with larger symbols for results that are based on at least two photometric systems. The dashed line shows the metallicity plateaus and the step-like discontinuity found by Lépine et al. (2011), and the solid lines are the fits to our spectroscopic cluster data using the complete sample for the inner disc and the mean value for the outer area (see Table 3). The grey area is the error range of the mean metallicity that we derived with a running average on the complete spectroscopic sample, as discussed in the text.
Current usage metrics show cumulative count of Article Views (full-text article views including HTML views, PDF and ePub downloads, according to the available data) and Abstracts Views on Vision4Press platform.
Data correspond to usage on the plateform after 2015. The current usage metrics is available 48-96 hours after online publication and is updated daily on week days.
Initial download of the metrics may take a while.