Fig. 2
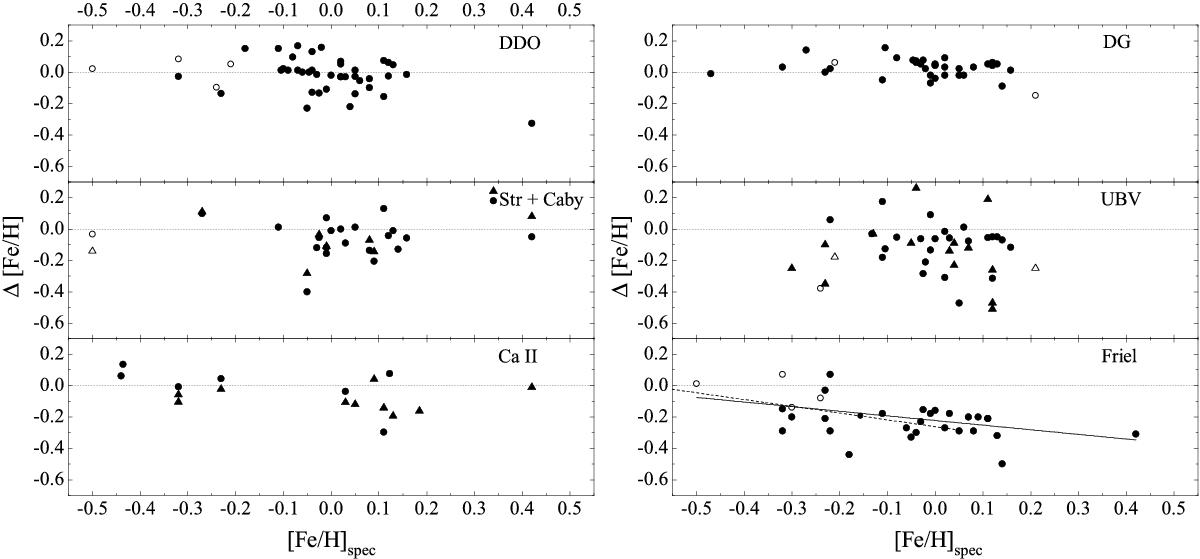
Comparison of the various photometric results with the spectroscopic mean values. The differences are given as Δ[Fe/H] = (photometry – spectroscopy). Filled and open symbols represent HQS and LQS data, respectively. Circles and triangles are used to distinguish Strömgren and Caby data, UBVp and UBVc metallicities, and the Caii results from the series by Carrera and Warren & Cole (2009). For the last system there is an overlap of two calibrators (Berkeley 39 and Melotte 66), and both results are shown. For guidance, we always used the same scale. One cluster is outside the range: Berkeley 21 (UBVc, Δ[Fe/H] = −0.78). The solid line in the lower right panel shows the linear fit to the Friel data, and the dashed line is the linear fit based on the five calibration clusters as discussed in the text.
Current usage metrics show cumulative count of Article Views (full-text article views including HTML views, PDF and ePub downloads, according to the available data) and Abstracts Views on Vision4Press platform.
Data correspond to usage on the plateform after 2015. The current usage metrics is available 48-96 hours after online publication and is updated daily on week days.
Initial download of the metrics may take a while.