Free Access
Fig. 10
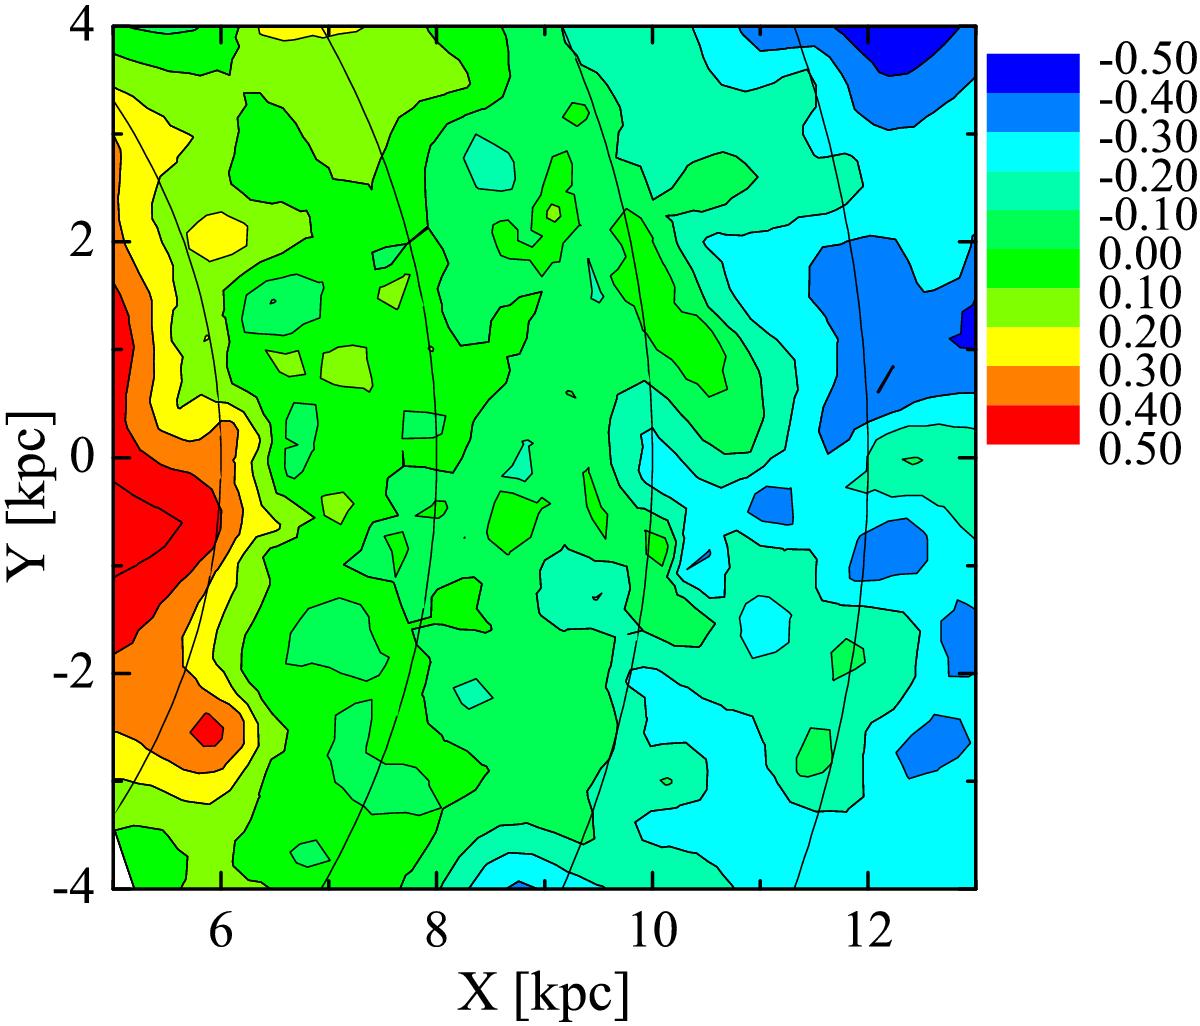
Contour plot of the metallicity distribution in the X/Y plane using a combined sample of Cepheids and open clusters. The orientation is as in Fig. 3. Solid lines indicate distances from the Galactic centre of 6, 8, 10, and 12 kpc.
Current usage metrics show cumulative count of Article Views (full-text article views including HTML views, PDF and ePub downloads, according to the available data) and Abstracts Views on Vision4Press platform.
Data correspond to usage on the plateform after 2015. The current usage metrics is available 48-96 hours after online publication and is updated daily on week days.
Initial download of the metrics may take a while.