Free Access
Fig. 2
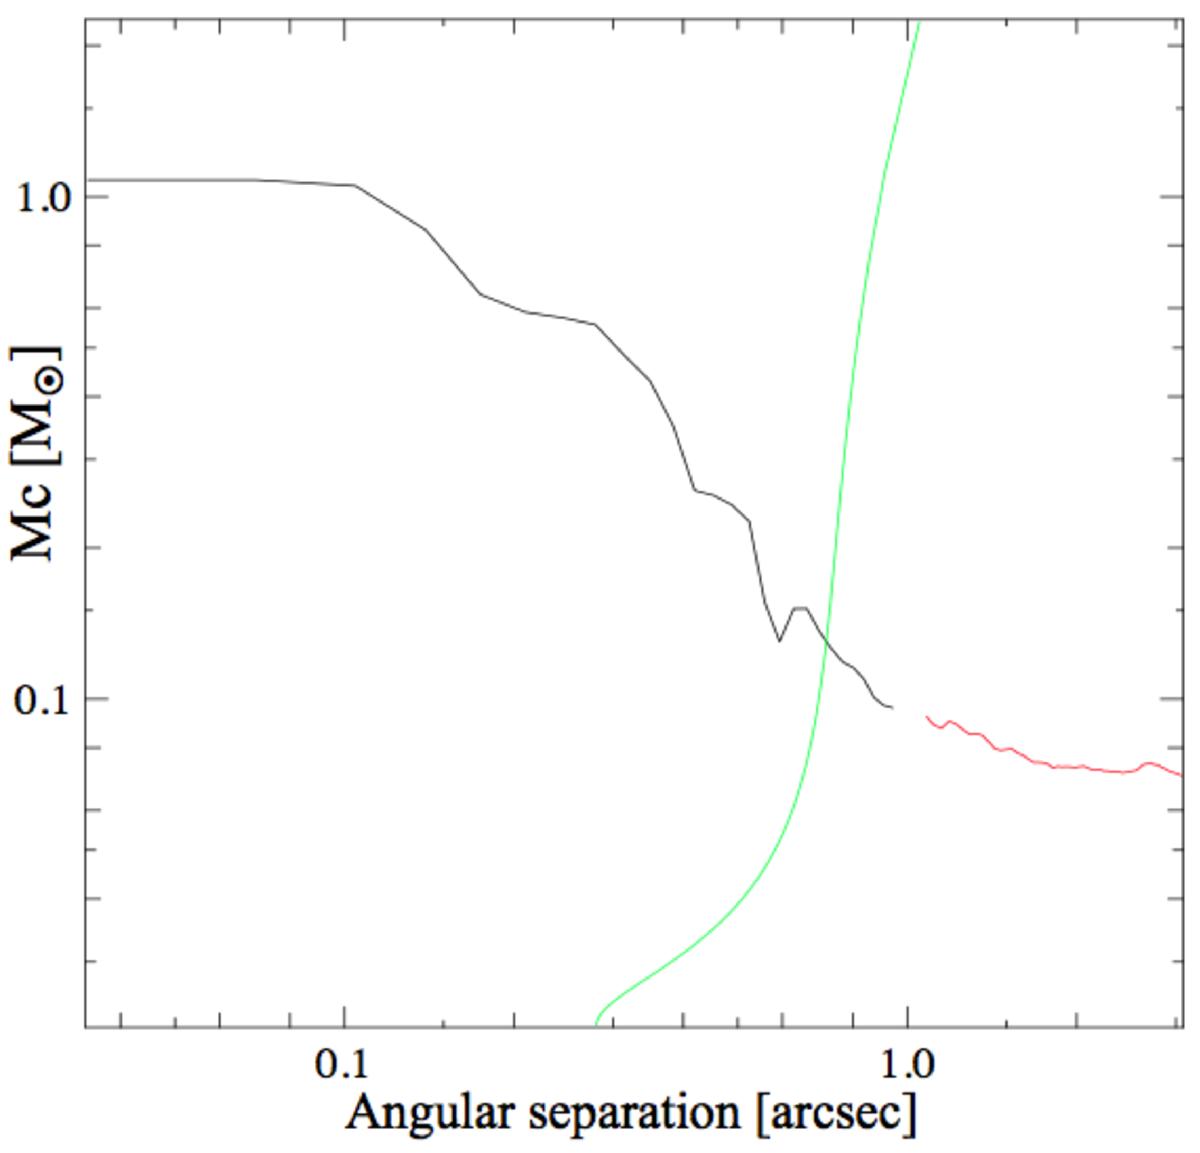
Mass detection limit as function of angular separation for HD 18757 observed with PUEO. The black and red curves correspond to NEXTGEN and DUSTY models, respectively. The green line represents the projected separation varying the orbital inclination and shows that no companion with a mass higher than 0.13 M⊙ was detected.
Current usage metrics show cumulative count of Article Views (full-text article views including HTML views, PDF and ePub downloads, according to the available data) and Abstracts Views on Vision4Press platform.
Data correspond to usage on the plateform after 2015. The current usage metrics is available 48-96 hours after online publication and is updated daily on week days.
Initial download of the metrics may take a while.