Fig. 5
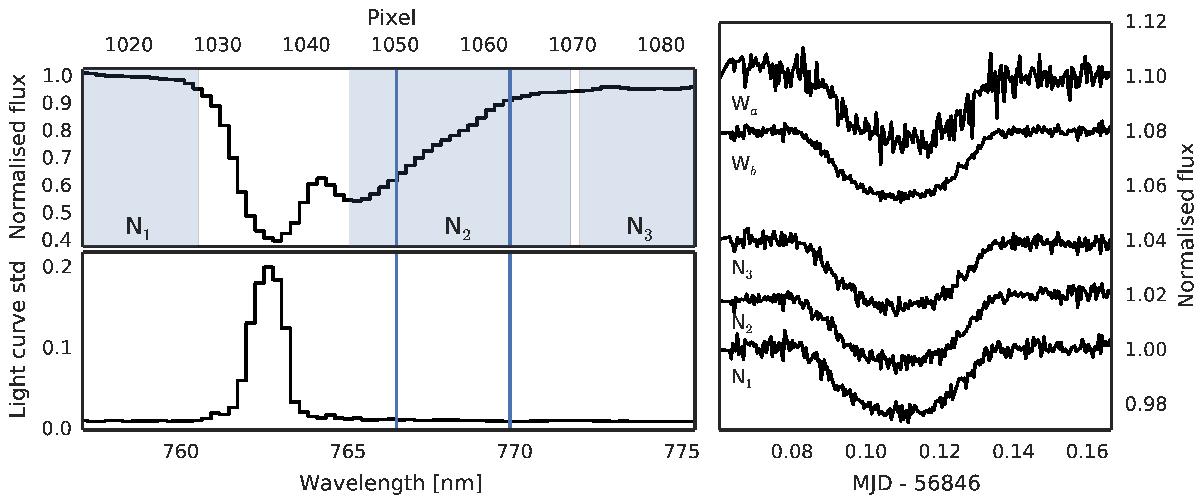
Upper left panel: a close-up of the TrES-3 spectrum with the K I resonance double lines marked as two vertical blue lines, and three passbands used to generate the narrowband light curves in the panel on the right marked as light blue shaded areas. Lower left panel: a scatter map based on light curves generated using one pixel in the wavelength axis. Right: light curves generated by integrating over the whole spectral range shown in the left panels (Wa), integrating over the three marked passbands (Wb, i.e. excluding the core of the telluric O2 absorption band), and integrated over the individual passbands (N1–N3).
Current usage metrics show cumulative count of Article Views (full-text article views including HTML views, PDF and ePub downloads, according to the available data) and Abstracts Views on Vision4Press platform.
Data correspond to usage on the plateform after 2015. The current usage metrics is available 48-96 hours after online publication and is updated daily on week days.
Initial download of the metrics may take a while.