Fig. 4
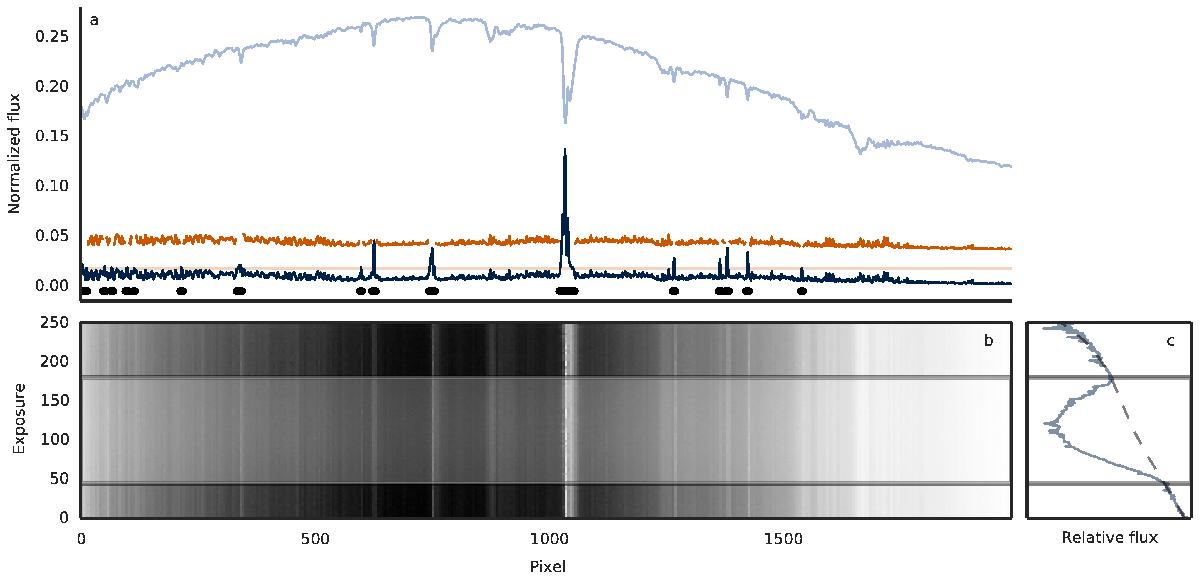
Spectrum masking: a) TrES-3 spectrum (light blue line), out-of-transit (OOT) standard deviation (σO) of a detrended light curve created using a single spectral pixel (dark blue line), maximum allowed σO (light orange horizontal line), OOT standard deviation with a mask (orange line), masked locations (thick black lines at bottom); b) the whole spectroscopic time series, time in the y-axis and wavelength (without wavelength calibration) in the x-axis, inside-transit duration marked between the two horizontal lines; c) broadband light curve with a fourth-order polynomial fitted to the OOT fluxes.
Current usage metrics show cumulative count of Article Views (full-text article views including HTML views, PDF and ePub downloads, according to the available data) and Abstracts Views on Vision4Press platform.
Data correspond to usage on the plateform after 2015. The current usage metrics is available 48-96 hours after online publication and is updated daily on week days.
Initial download of the metrics may take a while.