Fig. 2
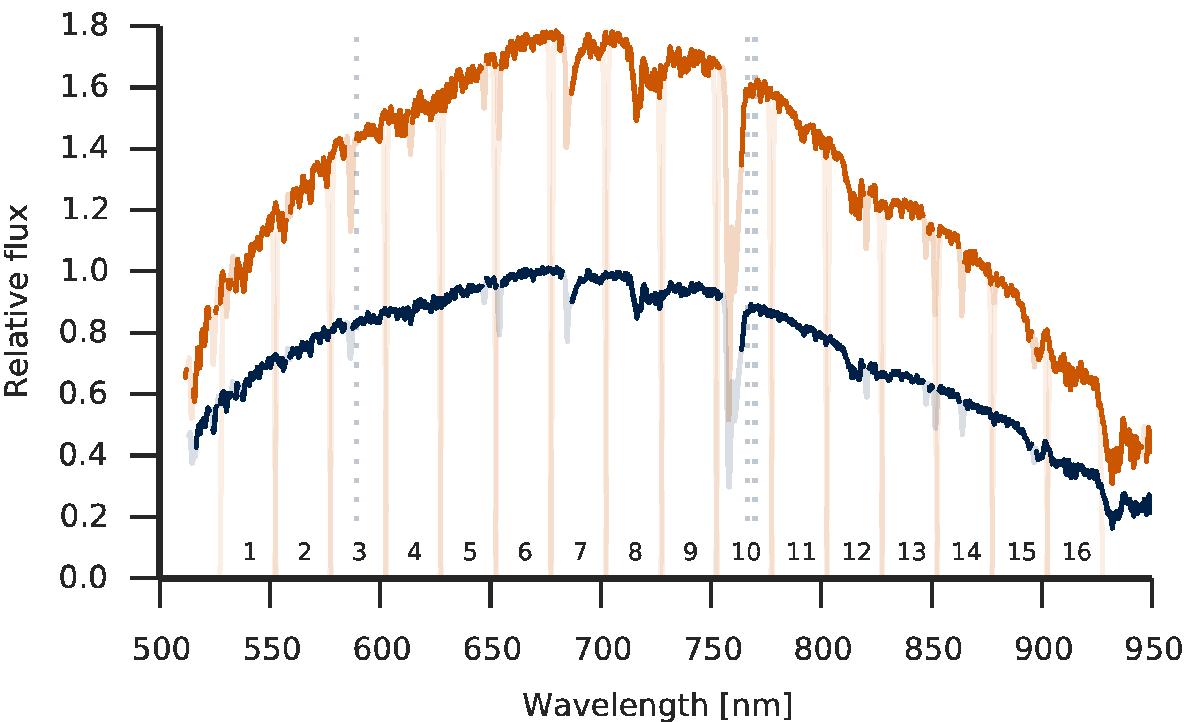
Sky-subtracted, wavelength-calibrated spectra for TrES-3 (dark blue line) and the simultaneously observed comparison star (orange line), both normalised with an arbitrary but common normalisation factor. The parts masked out during the generation of spectrum-masked light curves (see text) are shown with a lighter shade and the light orange vertical lines show the ranges used to generate the 16 narrowband light curves. The dotted vertical lines show the Ka I and Na I resonance doublets.
Current usage metrics show cumulative count of Article Views (full-text article views including HTML views, PDF and ePub downloads, according to the available data) and Abstracts Views on Vision4Press platform.
Data correspond to usage on the plateform after 2015. The current usage metrics is available 48-96 hours after online publication and is updated daily on week days.
Initial download of the metrics may take a while.