Fig. 14
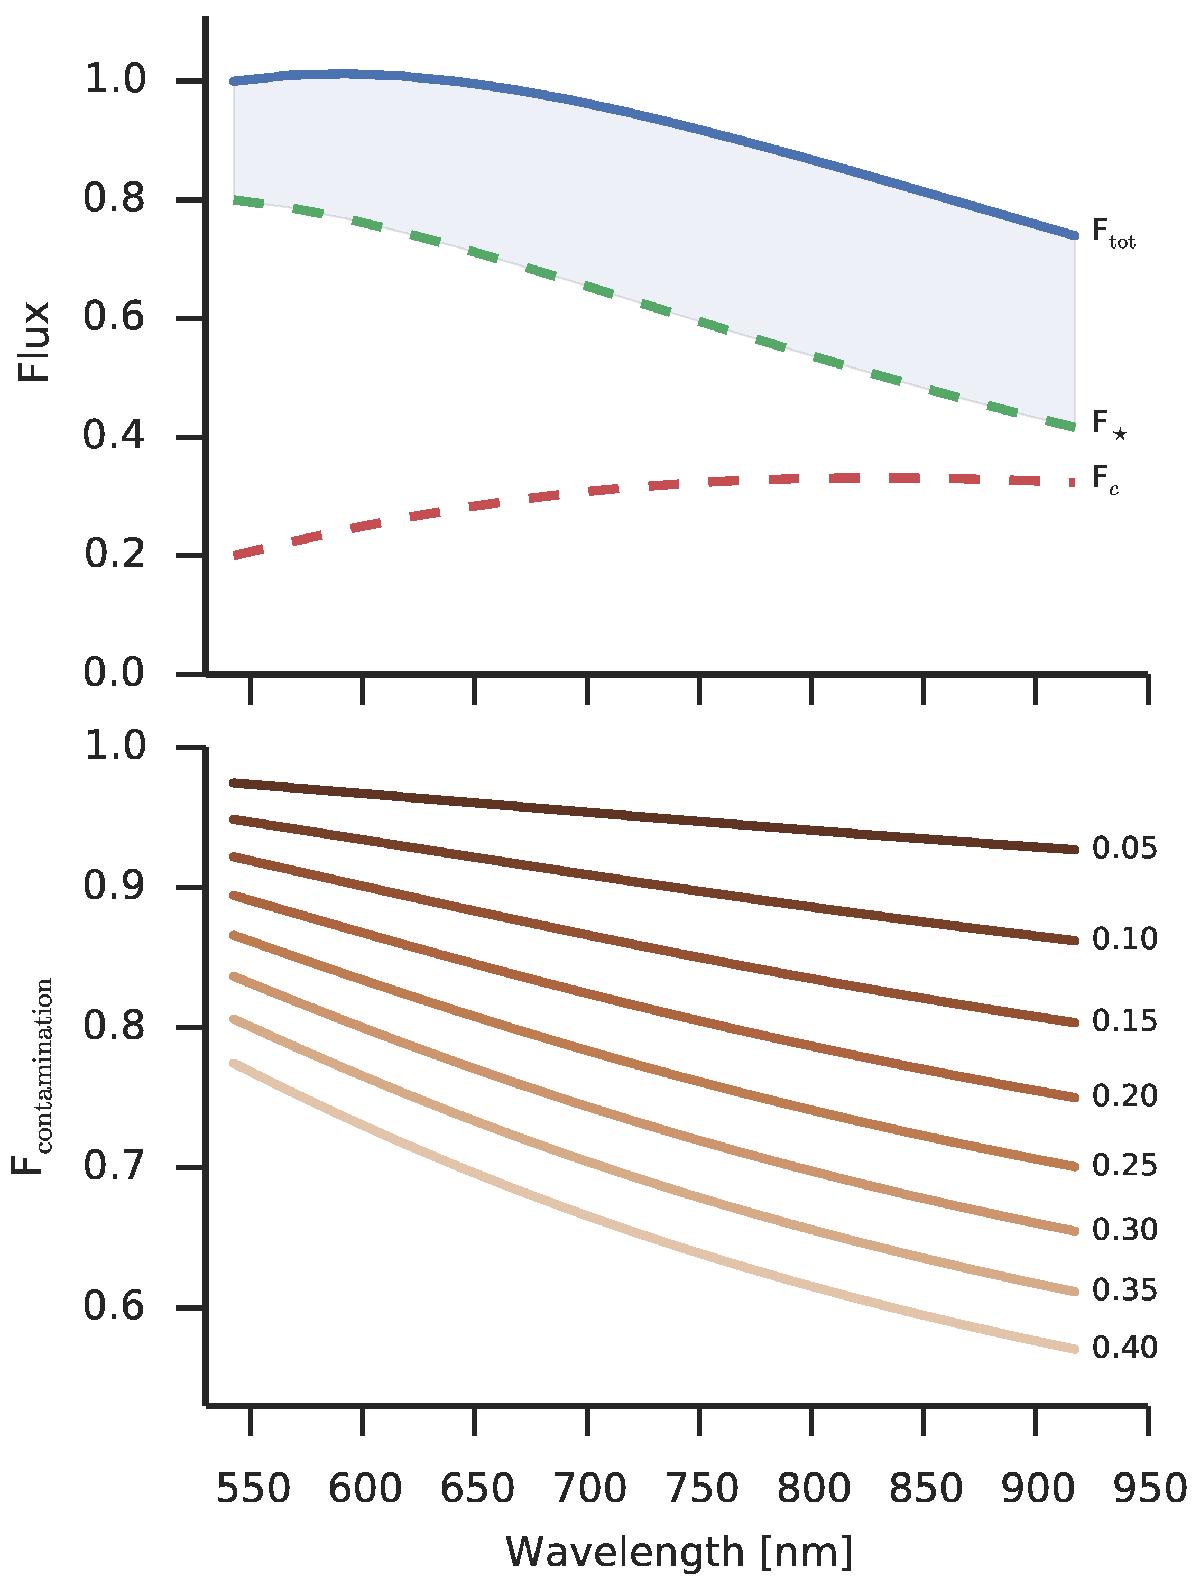
Effect of third-light contamination on the observed radius ratio. The upper panel depicts the contamination (with an exaggerated situation) as a light blue filled region with a 3500 K contaminant contributing 20% of the total flux at 545 nm. The solid blue line shows the total flux, the upper dashed line the target flux, and the lower dashed line the contaminating flux. The lower panel shows the wavelength-dependent effect of contamination for a 3500 K contaminant and contamination factor (at 545 nm) varying from 0.05 to 0.40. Contamination always decreases the observed radius ratio, but the exact behaviour depends on the temperature difference between the host star and the contaminant.
Current usage metrics show cumulative count of Article Views (full-text article views including HTML views, PDF and ePub downloads, according to the available data) and Abstracts Views on Vision4Press platform.
Data correspond to usage on the plateform after 2015. The current usage metrics is available 48-96 hours after online publication and is updated daily on week days.
Initial download of the metrics may take a while.