Fig. 8
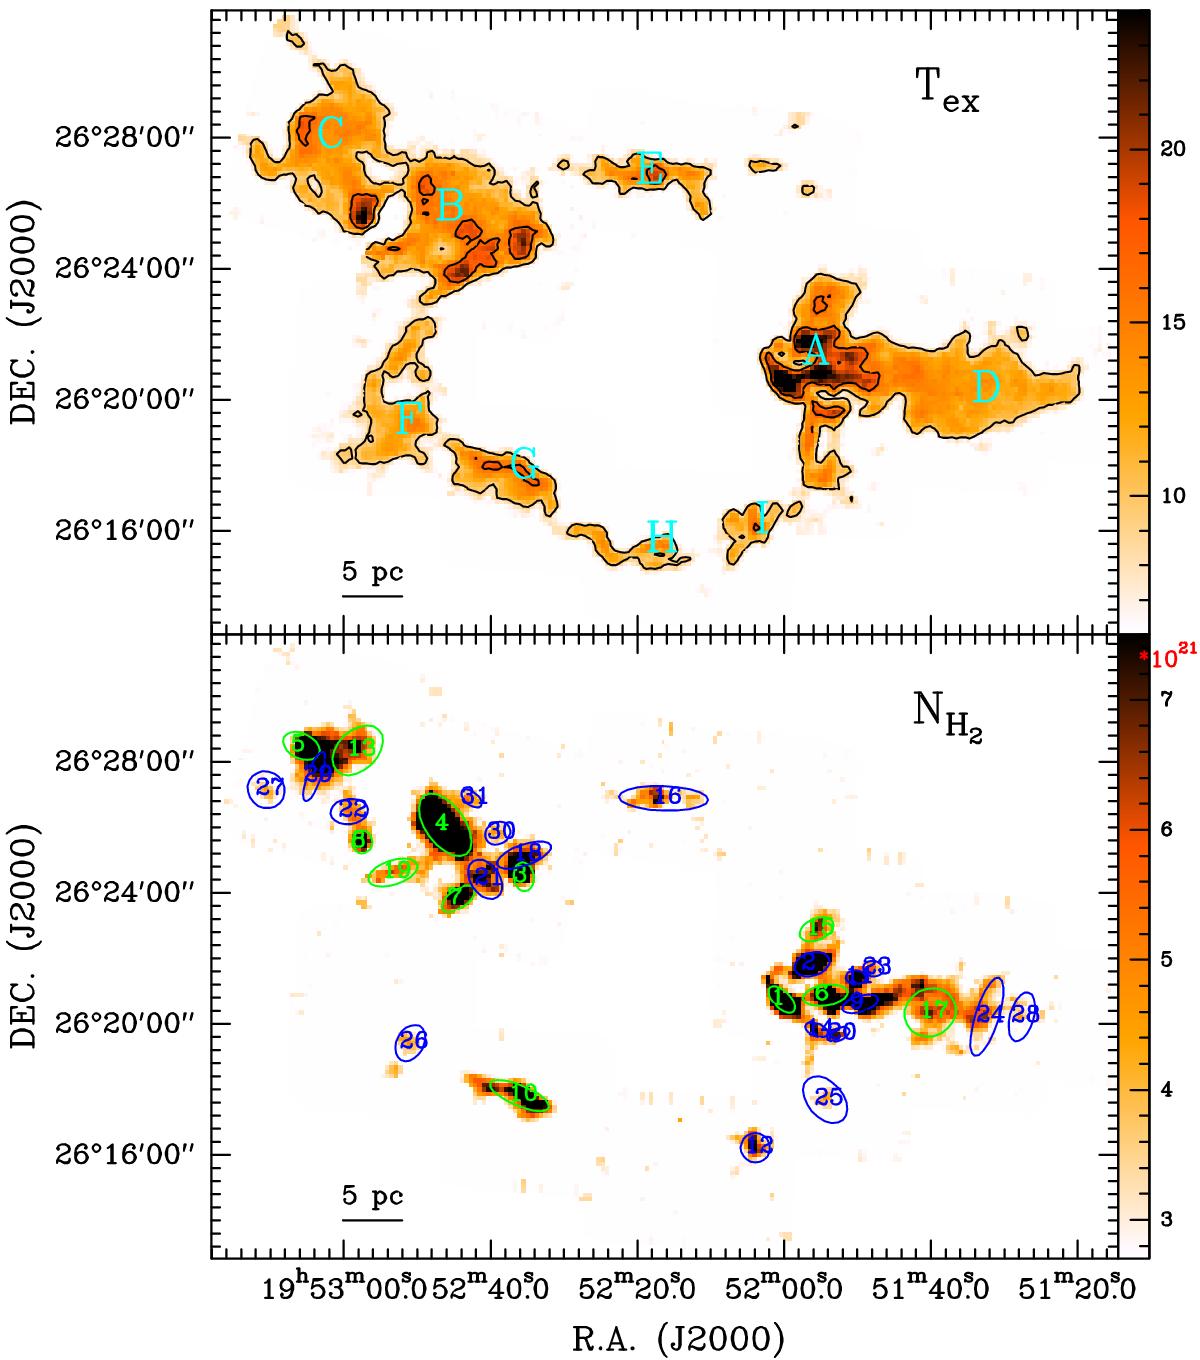
N131: CO (1–0) excitation temperature map (Tex; upper) and H2 column density distribution (NH2; lower). For Tex, the contour levels are 9.1 and 16.5 K, and the maximum is 30.6 K. The ellipses with numbers indicate the position and size of each fragment extracted by Gaussclumps. The letters from A to I indicate the positions of nine molecular clumps. The green and blue ellipses correspond to αvir< 1 and αvir> 1, respectively. The units for each colour bar are in Kelvin for Tex and 1021 cm-2 for NH2, respectively.
Current usage metrics show cumulative count of Article Views (full-text article views including HTML views, PDF and ePub downloads, according to the available data) and Abstracts Views on Vision4Press platform.
Data correspond to usage on the plateform after 2015. The current usage metrics is available 48-96 hours after online publication and is updated daily on week days.
Initial download of the metrics may take a while.