Fig. 6
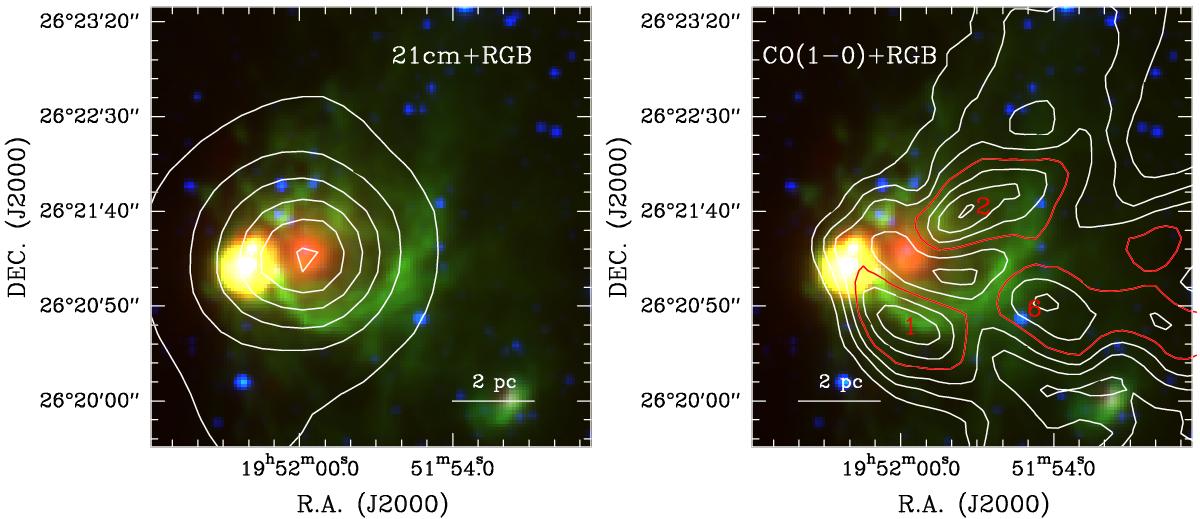
NVSS 21 cm continuum (left) and IRAM 30 m CO (1–0) (right) contours overlaid on a Spitzer-IRAC three-colour image of the secondary bubble N131-A with 4.5 μm = blue, 8 μm = green, and 24 μm = red. The contour levels start at 5σ in steps of 20σ with σ = 0.53mJy beam-1 for the 21 cm, and at 5σ in steps of 5σ with ![]() for the CO (1–0). The numbers 1, 2, and 6 indicate fragment positions from Table 1. These two maps are taken from the zoom-in in the dashed square of Fig. 2.
for the CO (1–0). The numbers 1, 2, and 6 indicate fragment positions from Table 1. These two maps are taken from the zoom-in in the dashed square of Fig. 2.
Current usage metrics show cumulative count of Article Views (full-text article views including HTML views, PDF and ePub downloads, according to the available data) and Abstracts Views on Vision4Press platform.
Data correspond to usage on the plateform after 2015. The current usage metrics is available 48-96 hours after online publication and is updated daily on week days.
Initial download of the metrics may take a while.