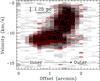
Fig. 5
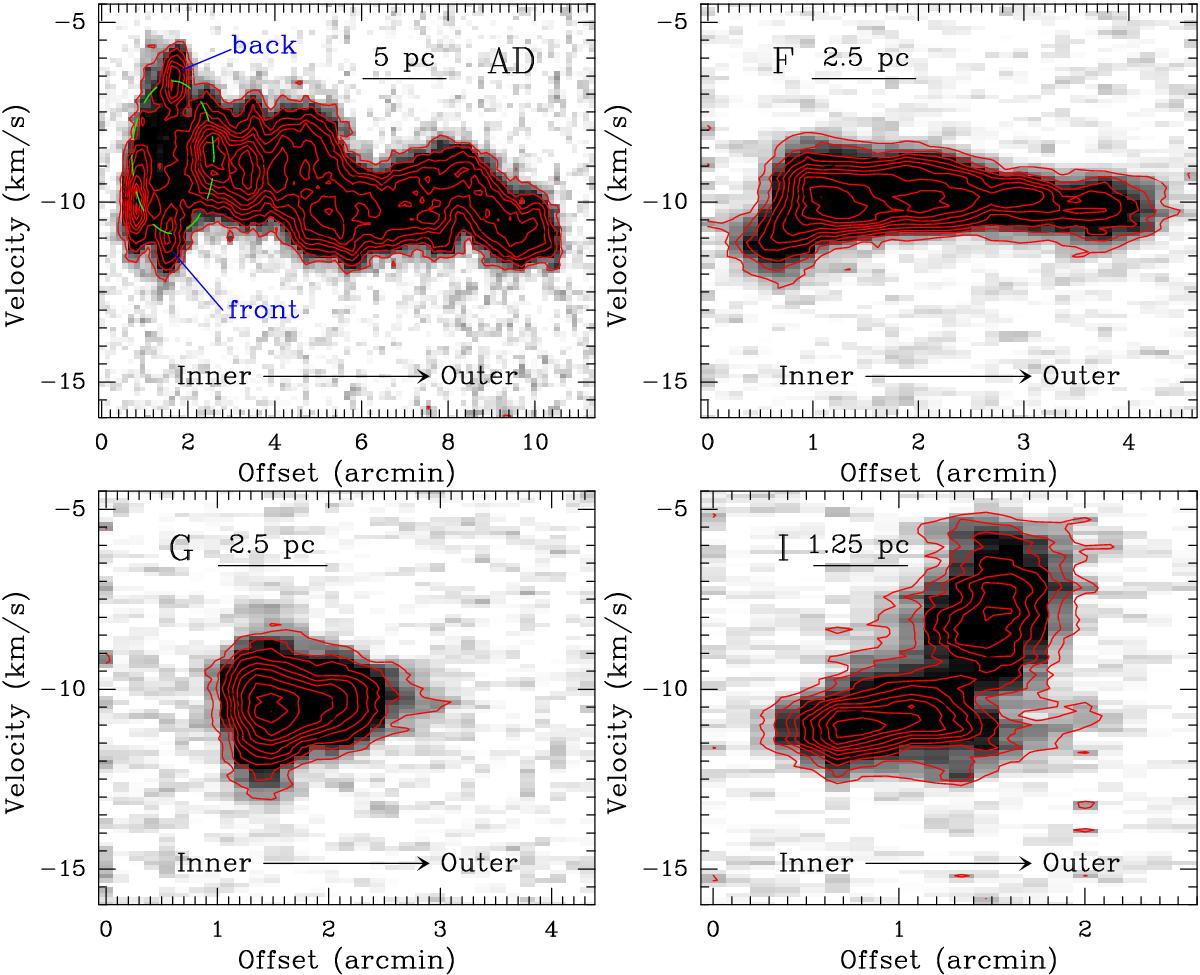
Position-velocity diagram from the inner edge to the outer edge of the ring-like shell through the clumps AD, E, F, and I for the CO (1–0). The cutting paths are shown in Fig. 3. The green dashed ellipse indicates the 3D structure of the secondary bubble N131-A with front and back sides. Contour levels start at 3 times the rms level of 1.5 K and increase in steps of 1.5 K.
Current usage metrics show cumulative count of Article Views (full-text article views including HTML views, PDF and ePub downloads, according to the available data) and Abstracts Views on Vision4Press platform.
Data correspond to usage on the plateform after 2015. The current usage metrics is available 48-96 hours after online publication and is updated daily on week days.
Initial download of the metrics may take a while.