Free Access
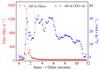
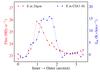
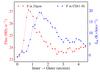
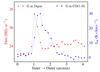
Fig. 4
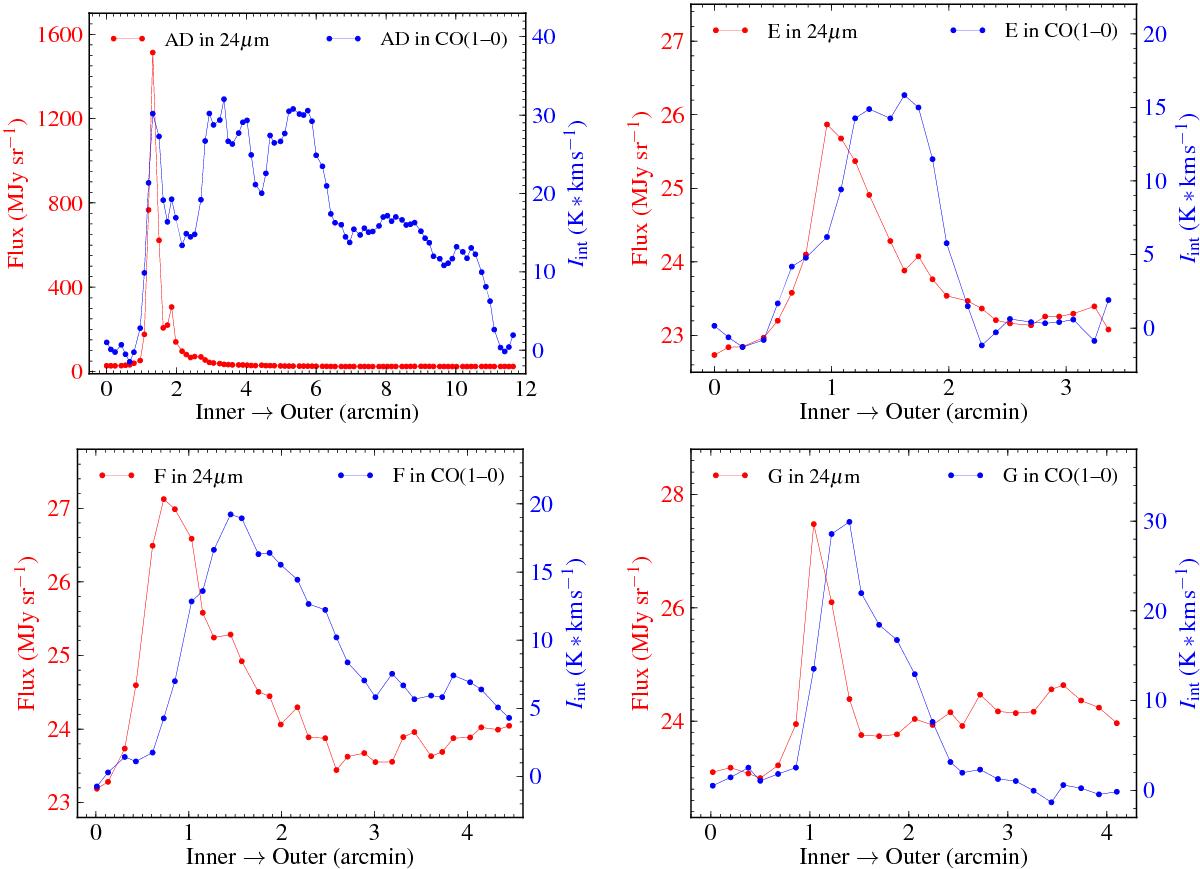
Slice profiles of 24 μm (red) and CO (1–0) emission (blue) from the inner edge to the outer edge of the ring-like shell through the clumps AD, E, F, and G. The cutting paths are shown in Fig. 3. The profiles show a distribution of steep rise at the inner edge and a gradual fall at the outer edge.
This figure is made of several images, please see below:
Current usage metrics show cumulative count of Article Views (full-text article views including HTML views, PDF and ePub downloads, according to the available data) and Abstracts Views on Vision4Press platform.
Data correspond to usage on the plateform after 2015. The current usage metrics is available 48-96 hours after online publication and is updated daily on week days.
Initial download of the metrics may take a while.