Fig. 3
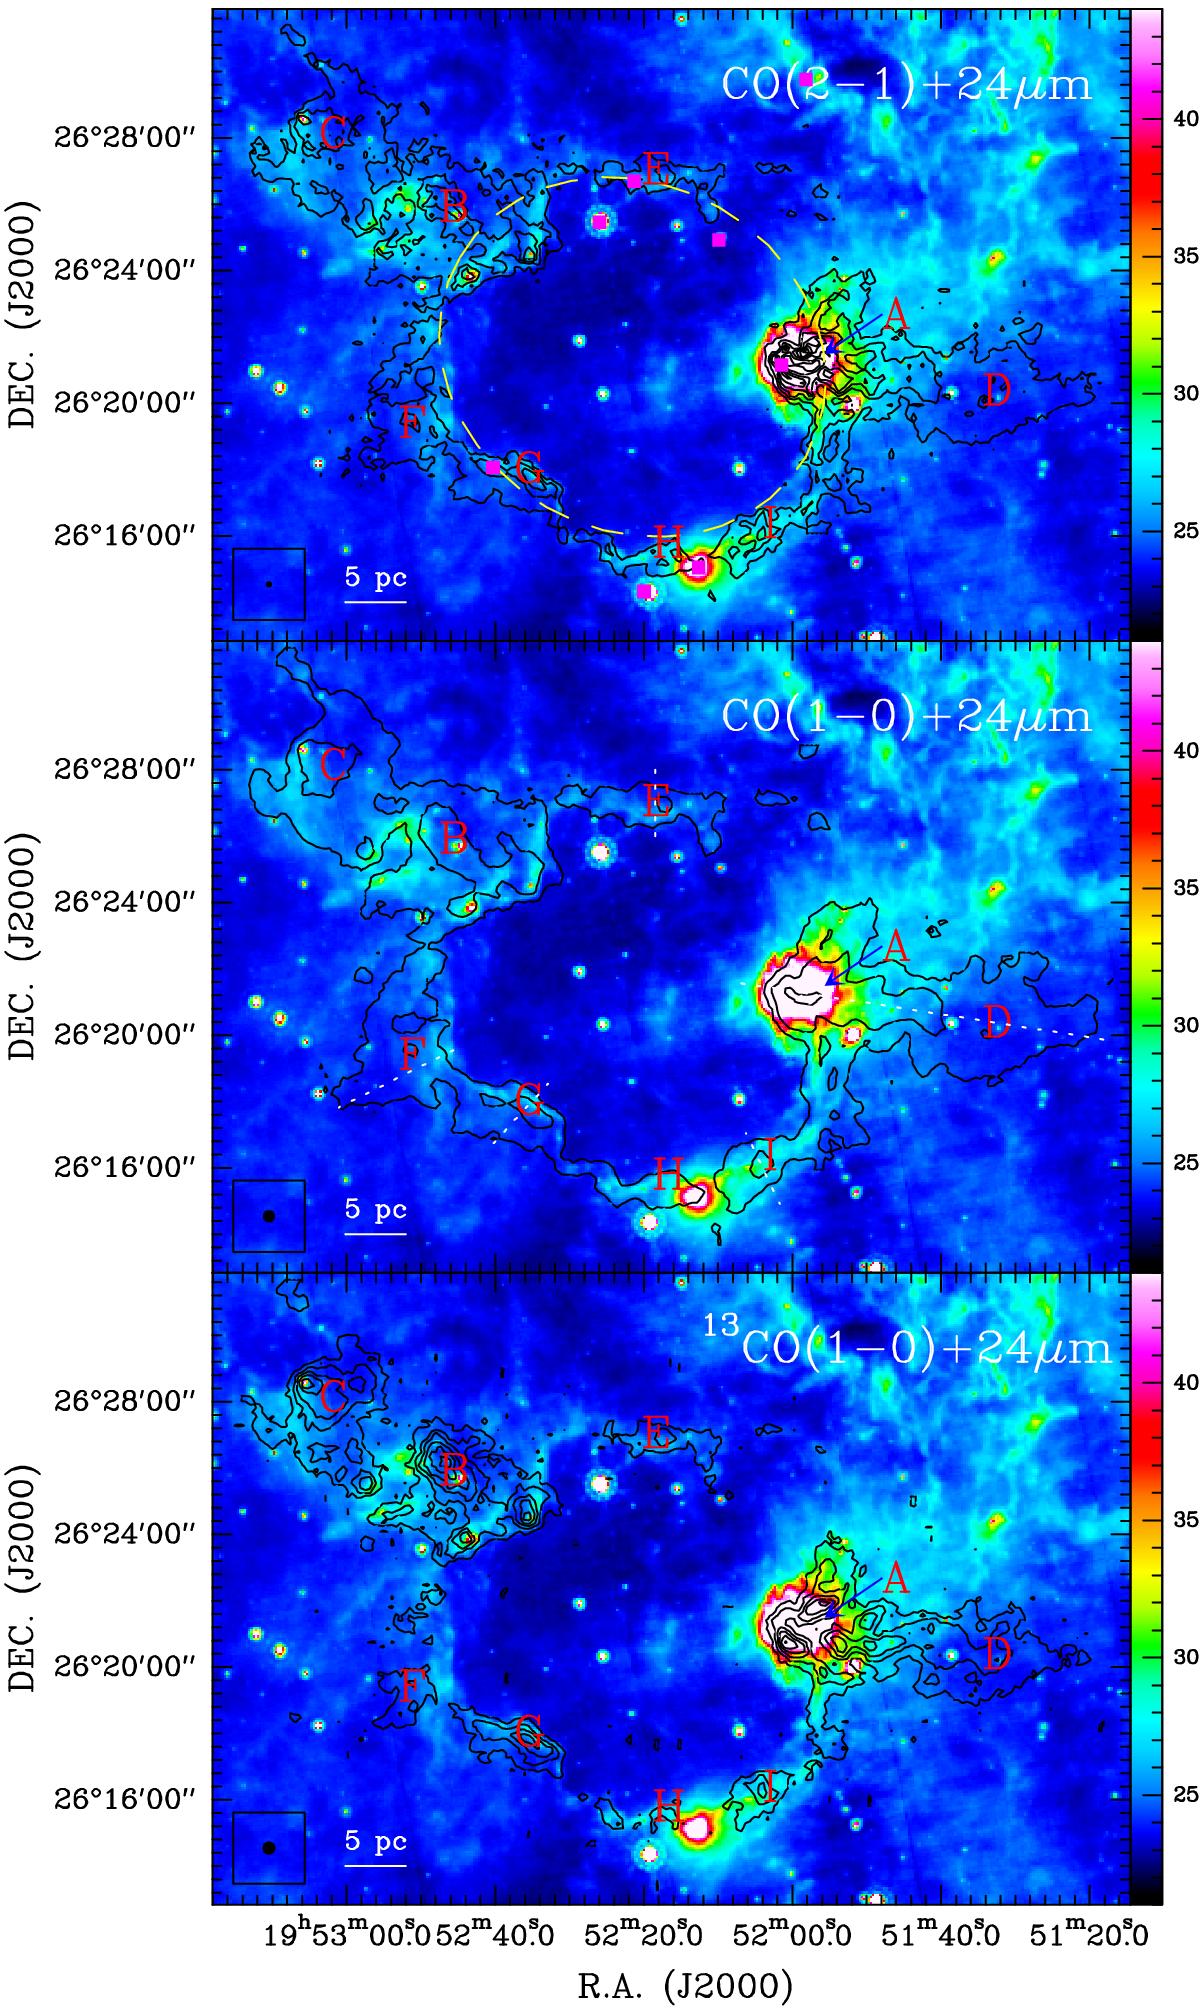
Integrated intensity maps of the CO (2–1) (upper), CO (1–0) (middle), and 13CO (1–0) (lower) lines with velocity range from −14.5 to −6.5 km s-1 superimposed on 24 μm emission. The contour levels start are at 3σ in steps of 5σ for CO (2–1) (![]() ), CO (1–0) (
), CO (1–0) (![]() ), and 13CO (1–0) (
), and 13CO (1–0) (![]() ). The beam size of each subfigure is indicated at the bottom-left corner. The symbols “■”, letters (A, B, ..., and I), and ellipse indicate the positions of eight IRAS point sources, nine molecular clumps, and ring-like shell of the bubble, respectively. The unit of each colour bar is in MJy sr-1. The dotted lines show the cutting direction of the slice profiles in Fig. 4 and the PV diagram in Fig. 5.
). The beam size of each subfigure is indicated at the bottom-left corner. The symbols “■”, letters (A, B, ..., and I), and ellipse indicate the positions of eight IRAS point sources, nine molecular clumps, and ring-like shell of the bubble, respectively. The unit of each colour bar is in MJy sr-1. The dotted lines show the cutting direction of the slice profiles in Fig. 4 and the PV diagram in Fig. 5.
Current usage metrics show cumulative count of Article Views (full-text article views including HTML views, PDF and ePub downloads, according to the available data) and Abstracts Views on Vision4Press platform.
Data correspond to usage on the plateform after 2015. The current usage metrics is available 48-96 hours after online publication and is updated daily on week days.
Initial download of the metrics may take a while.